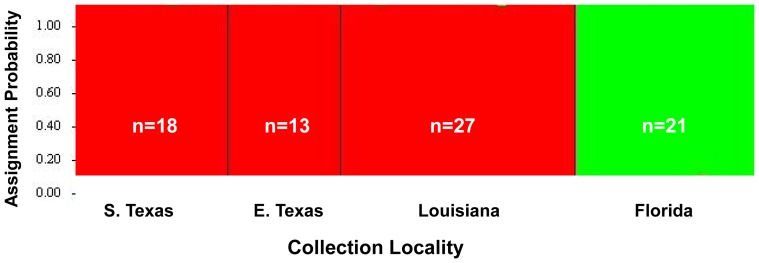
Figure 2. Structure 2.2 analysis depicts two genetically distinct clusters of D. saccharalis.
Individuals from southern Texas (S. Texas), eastern Texas (E. Texas) and Louisiana grouped together within the red cluster, while individuals from Florida grouped within the green cluster. The y-axis shows the probability of each individual to belong to a genetically distinct cluster. The number of individuals from each region used for the analysis is represented by ‘n’.

