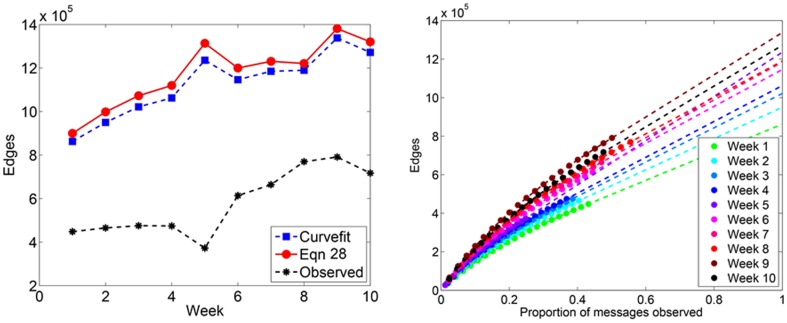
Figure 9. Predicted number of edges in Twitter reply networks.
(Left) A small proportion of observed messages for Week 5 (<25%) may explain the spike in the estimated number of edges for that week. (Right) Each data point represents the number of directed edges observed, averaged over 100 simulated subsampling experiments. The dashed line extrapolates the predicted number of edges for greater proportions of sampled data.

