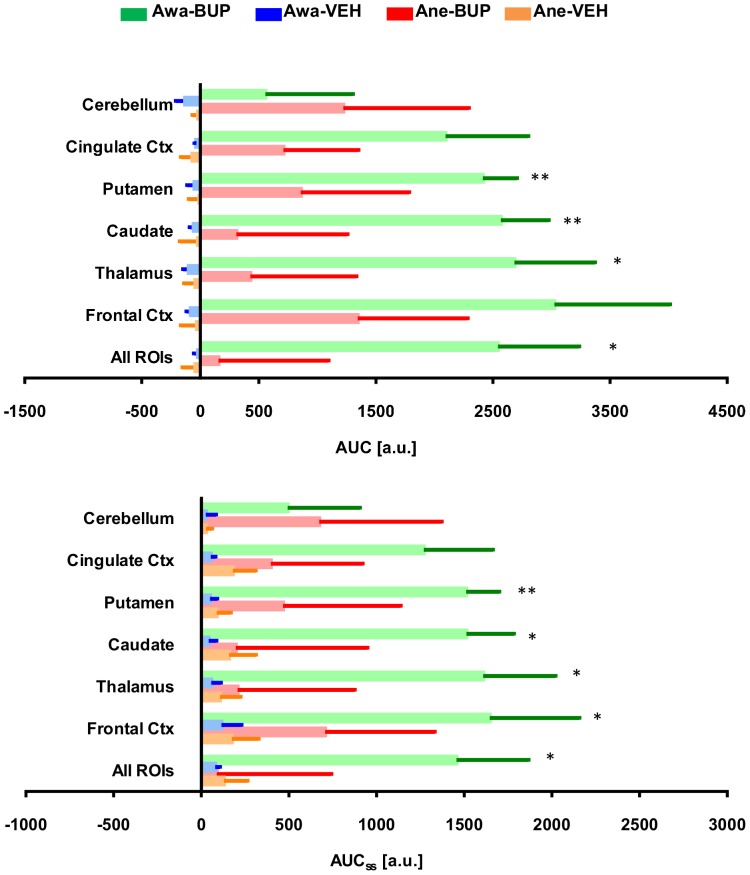
Figure 7. Area-under-curve of regional time-course rCBV change during post-drug infusion derived from the region-of-interest analysis.
Results obtained from region-of-interest (ROI) analyses of rCBV time-course data showing the area-under-curve (mean ± SEM) of the entire post-drug infusion period (AUC) or only the steady-state time period (AUCss). Animals (n = 4) were imaged under awake (Awa) or anesthetized (Ane) conditions and treated with either buprenorphine (BUP at 0.03 mg/kg i.v.) or vehicle (VEH). Our data indicated that in awake animals AUC and AUCss calculated from thalamus, caudate nucleus, and putamen are significantly higher in buprenorphine-treated animals (paired t-test, *p<0.05, **p<0.01 vs vehicle).

