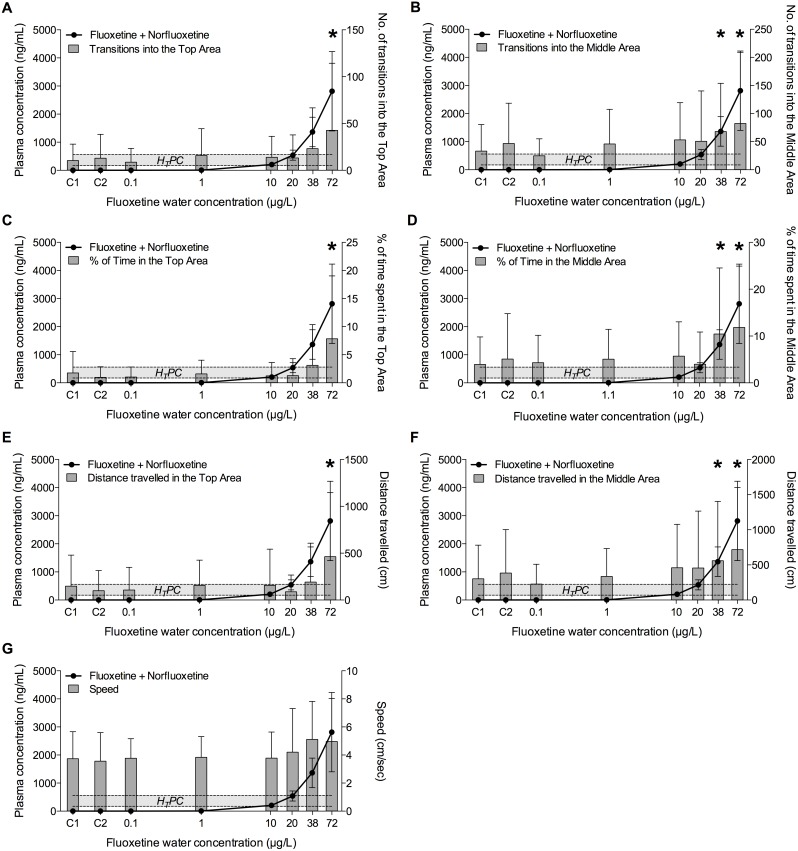
Figure 6. Relationship between plasma concentrations of fluoxetine plus norfluoxetine and their effects on fish exploratory behaviour after 28 days of exposure.
Exploratory behaviour was quantified in individual fish using the Novel Tank Diving Test. A) Number of transitions into the Top Area; B) number of transitions into the Middle Area; C) time spent in the Top Area; D) time spent in the Middle Area; E) distance travelled in the Top Area; F) distance travelled in the Middle Area; G) speed. The Human Therapeutic Plasma Concentration range of fluoxetine + norfluoxetine plotted in the graphs is 163–560 ng/mL. C1 and C2 indicate control group 1 and control group 2, respectively. The X-axis has a Log2 scale, while the Y-axis has a linear scale. Values are plotted as mean ± SD (n = 20). *: p<0.05.

