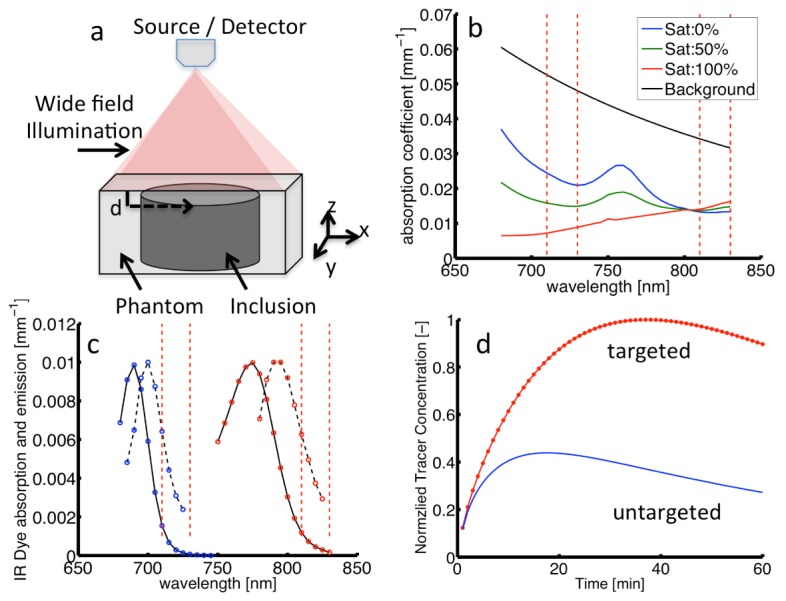
Fig. 3.

a) Schematic of simulated measurement geometry. b) Absorption spectra for 2% blood volume at selected saturations and background absorption. c) Absorption (solid) and emission (dashed) spectra for dual tracers (i.e. IR700 and IR800). Vertical dashed lines in both panels represent integrated waveband for fluorescence intensity. d) Time-dependent concentrations of targeted and untargeted tracers for binding potential = 1.7.
