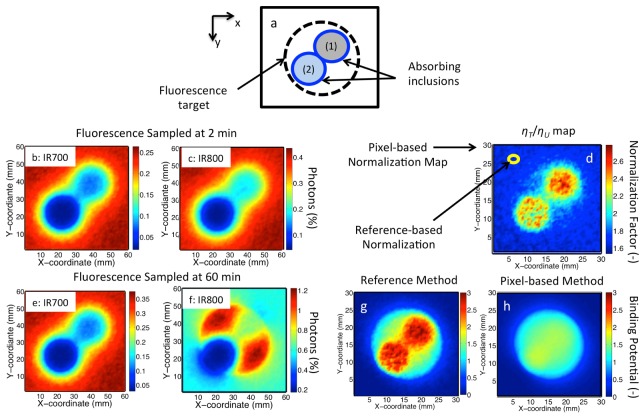
Fig. 5.
a) Model geometry of a turbid medium containing two absorption inclusions (1) BVF = 25%, Sat = 50% and (2) BVF = 100%, Sat = 0%. b) and c) Show simulated fluorescence images with of IR700 and IR800 at 2 min, respectively. d) Shows the pixel-based normalization map. e) and f) Show simulated images of both tracers at 60 min. g) and h) Show binding potential maps for images in the presence of the absorption inclusions as estimated by both the reference tracer method and pixel-by-pixel normalization method, respectively.

