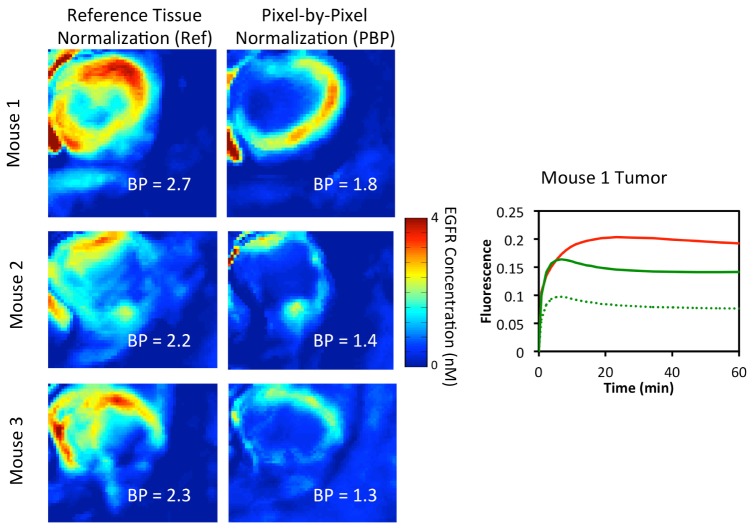
Fig. 6.
Binding potential maps calculated using the reference tissue-based normalization (first column of images) and the pixel-based normalization approach (second column of images) are presented for 3 athymic mice with subcutaneous xenograph glioma tumors. The binding potential (BP) measured in each case within the tumor is displayed on the figure. For reference, the white-light image for Mouse 1 is depicted in Fig. 1(a). On the far right, the average targeted tracer uptake (red curve) in the tumor is presented along with the untargeted tracer uptake after normalization by the reference tissue-based approach (dotted green curve), and by the pixel-based approach (solid green curve).

