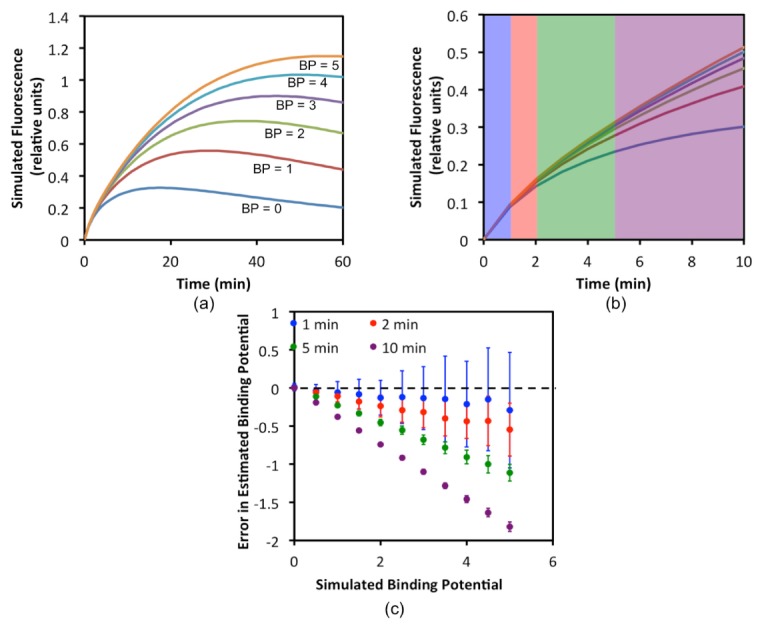
Fig. 7.

Simulation study results to determine the optimal time-window in which to normalize targeted and untargeted tracer uptake curves to correct for optical property and detection efficiency mismatch between tracers. In (a), the various simulated targeted tracer uptake curves based on binding potentials (BP) between 0 and 5 are presented over 60 min. In (b), the same curves in (a) are re-plotted for just the first 10 min of uptake. The shaded regions demonstrate the ranges over which the 1-min (blue), 2-min (red), 5-min (green), and 10-min (purple) normalizations were carried out. The results of these normalizations and their affects on BP estimation are presented in (c) in the form of a Bland-Altman.
