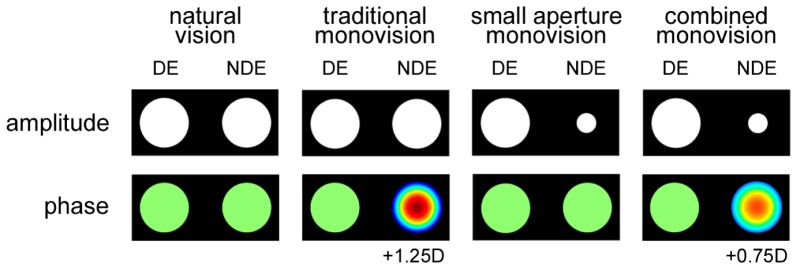
Fig. 2.

Overview of the binocular optical conditions for which through-focus visual acuity was assessed. The upper row shows the binary amplitude and the lower row shows the phase maps of the complex pupil functions for the dominant and nondominant eye (DE and NDE). Natural vision was simulated with 4mm pupils and best corrected distance vision in both eyes. For the different types of monovision, the optics of the NDE was modified as depicted in the Figure.
