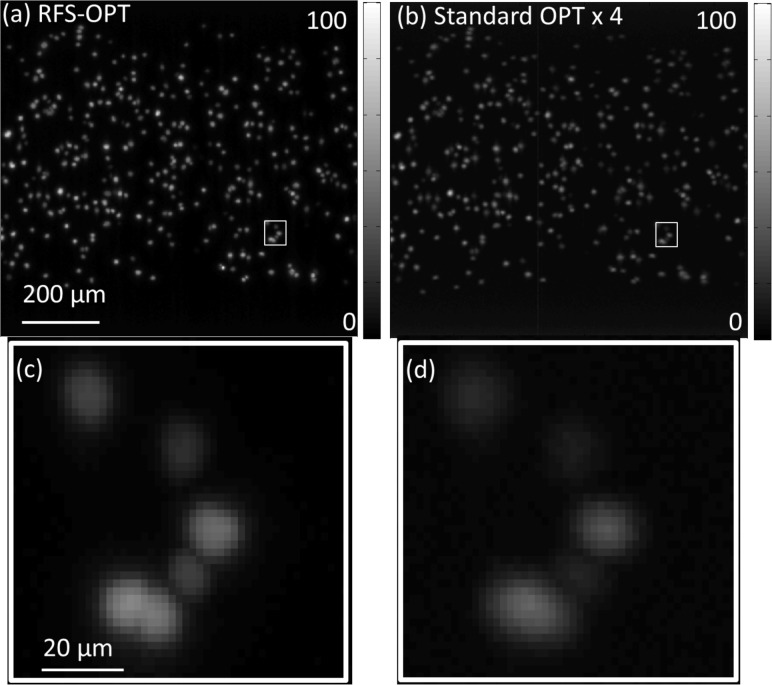
Fig. 4.
A section of reconstructed maximum intensity projection images of clusters of cells that exhibit mCherry labelling in the nucleus acquired with (a) RFS-OPT and (b) standard OPT plotted with absolute intensity scales for comparison; Zoom in MIPs of regions of interest of (c) RFS-OPT and (d) Standard OPT (rectangular boxes in (a,b)). It is noted that the standard OPT intensity data has been multiplied by 4 for clarity. Scale bar: (a, b) 200 μm; (c,d) 20 μm.

