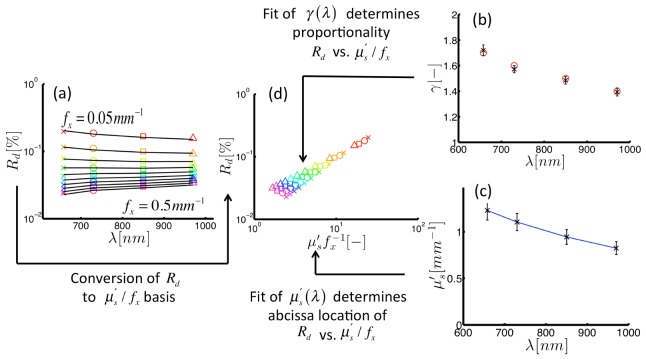
Fig. 4.
Inversion of demodulated reflectance model using simulated data. (a) Demodulated reflectance spectra sampled at multiple spatial frequencies (color markers) from a medium with background scattering properties, and , specified with the color markers in (b) and (c), respectively. (d) Reflectance from spectra in panel (a) plotted vs. dimensionless scattering clearly showing a -specific slope. Here, different symbols indicate wavelength, and colors define spatial frequency. The inversion algorithm returns a fitted estimate of reflectance (shown as black lines in (a)) and estimates optical properties (shown by black markers in (b) and (c)).

