
Fig. 5.
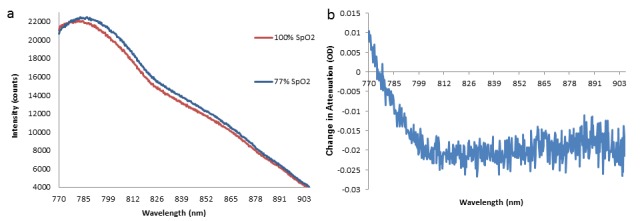
a) Example of intensity spectra before desaturation (SpO2 = 100%) and at the nadir of desaturation (SpO2 = 77%) in subject 003, left side channel, from the longest source-detector distance. A shift in the peak of the spectrum is observed. b) Change in attenuation between intensities shown in a) – this relates to Δ[HbO2] = ~-6 μM, Δ[HHb] = ~3 μM and Δ[oxCCO] = ~-1.5μM.