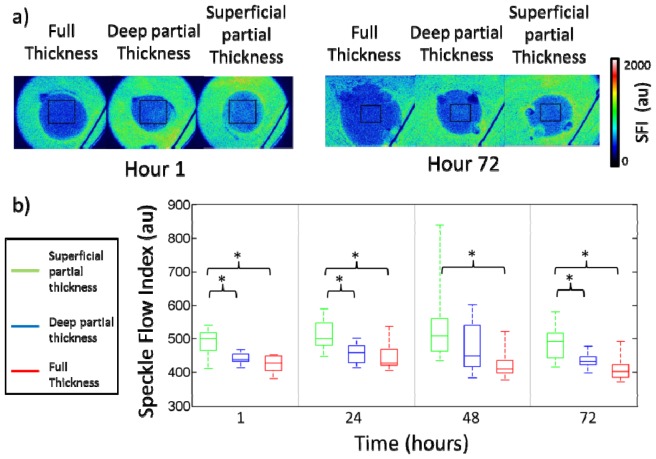
Fig. 5.
a) Representative images of blood flow for the three burn categories at hour 1 and hour 72. b) Box and whisker plot of average blood flow for different burn categories as determined using laser speckle imaging. Time points with statistically significant differences between groups are indicated with an asterisk.

