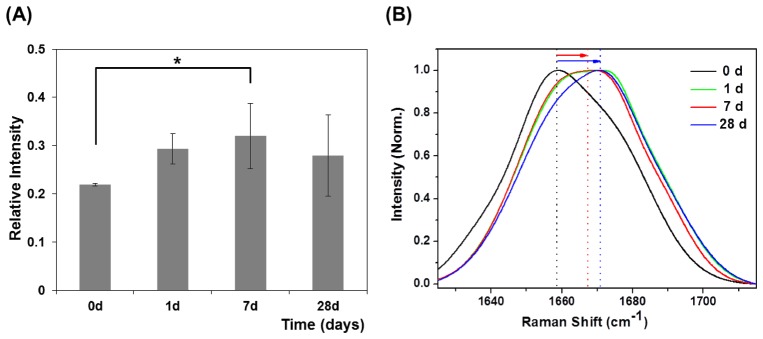
Fig. 7.

(A) Relative intensities in 1667 cm−1 Raman peaks during orthodontic treatment. *Significantly different from day 0 (P < 0.05, one-way ANOVA with Turkey’s HSD post-hoc procedure). (B) Normalized average GCF Raman spectra in the 1625-1715 cm−1 range during orthodontic treatment.
