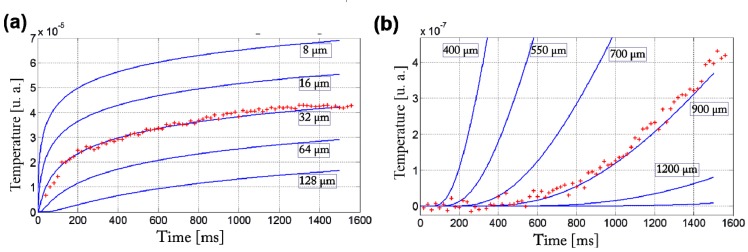
Fig. 3.
The time response of the two regions enhanced in blue and red in Fig. 2(b) are shown in figure (a) and (b) respectively (dots). The various curves represent the phase difference integrated along a path of a few mm for various particle-probe distances, as a function of time given by a step excitation in the heat diffusion model.

