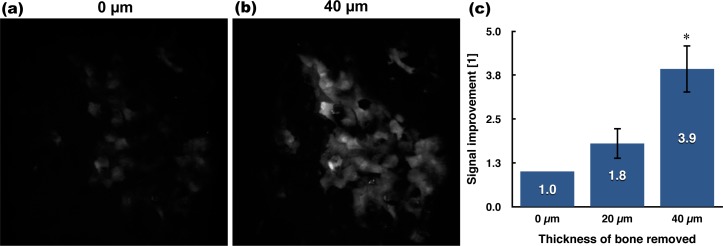
Fig. 2.
TPEF signal increase at the endosteum. Maximum-intensity projection images of GFP-expressing osteolineage cells residing at the endosteum (a) before and (b) the removal of 40 μm of bone. More cells are visible after local osteotomy, illustrating the increase in TPEF signal. Image width: 360 μm. (c) Quantification of TPEF signal improvement as a function of bone removed (n=3, *one-sided paired t-test with Bonferroni correction on absolute intensity - standard deviation).

