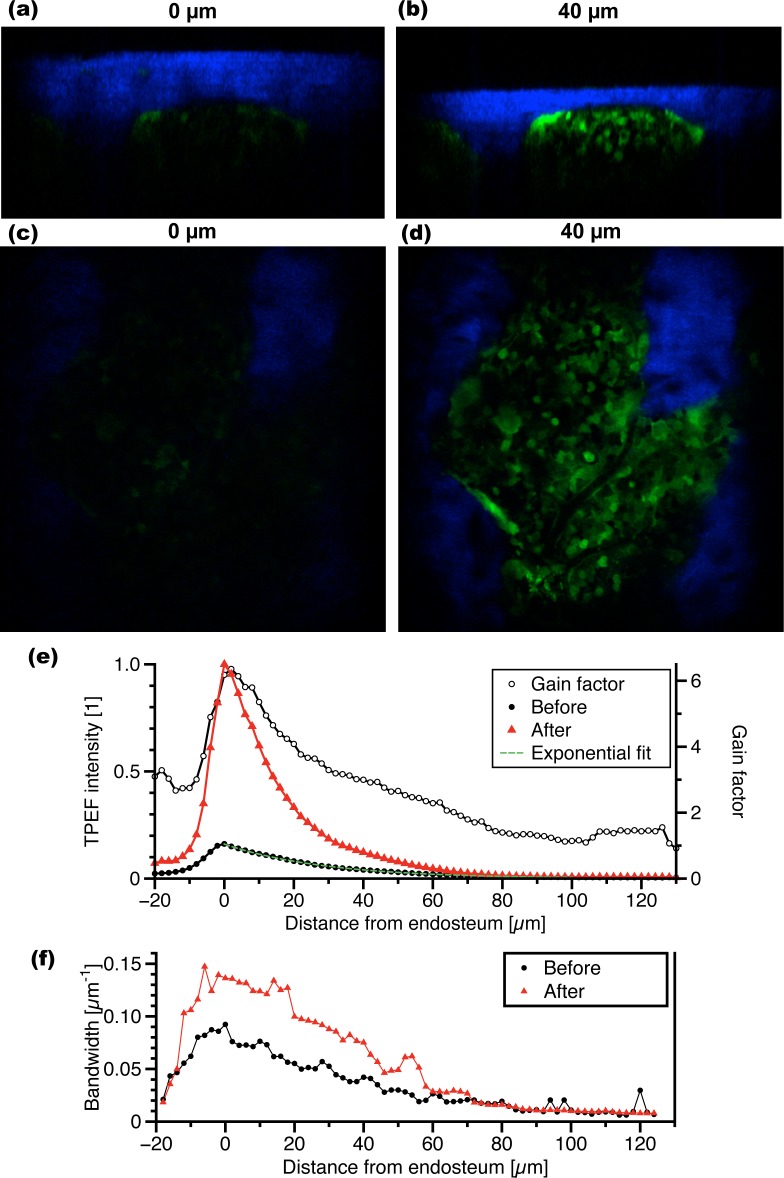
Fig. 4.
Imaging improvement with depth in the BM. The top row images are three-dimensional reconstructions of sagittal cross-sections (a) before and (b) after local laser osteotomy. Cortical bone (blue) sits on top of a BM compartment containing GFP+ cells (green). The second row images show a single axial plane in the BM (c) before and (d) after local laser osteotomy. Image width: 360 μm. (e) The relative TPEF intensity from actin-GFP cells is plotted as a function of depth before and after local laser osteotomy. Flat regions at the endosteum were selected (n=5) and the cumulative GFP signal in each axial plane was normalized to the maximum cumulative intensity at the endosteum. (f) The lateral spatial frequency bandwidth is plotted as a function of depth before and after local laser osteotomy.

