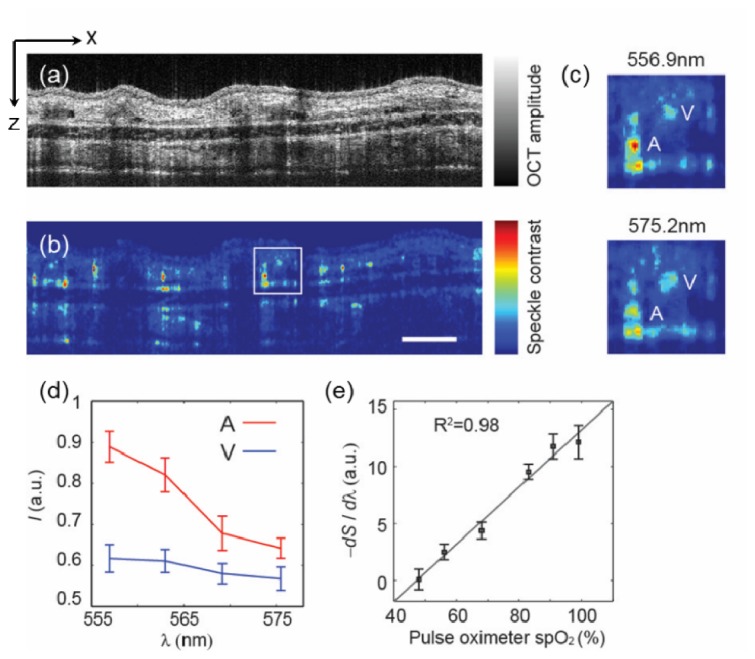
Fig. 2.

(a-b) Examples of OCT cross-sectional images and microangraphies from a mouse ear in vivo. The cross-sectional angiography was obtained from a wavelength band centered at 602 nm with 15 nm FWHM. Bar: 0.2 mm. (c) Magnified view of the squared area in panel b at two different center wavelengths. An arteriole (A) and a venule (V) were labeled. (d) The spectral profiles from the arteriole and venule in panel c. (e) Calibration of the first derivative of the spectra to the spO2 reading from a pulse oximeter attached to the rear left leg of the animal. The OCT spectra were sampled from an arteriole. Error bar is the standard error of mean (s.e.m.) (n = 20 indicates 20 repeated measurements at same locations)
