Fig. 3.

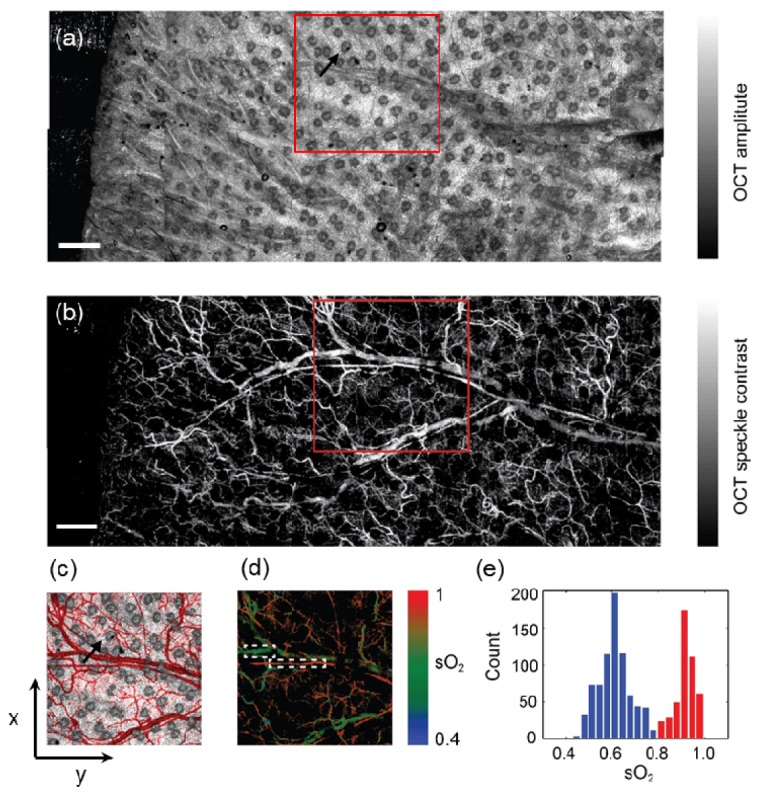
(a-b) Mean-value-projection images of the 3D OCT mosaic and the label-free microangiography from a mouse ear in vivo, where ten images were stitched. The black arrow in panel a highlights a sebaceous gland. Bar: 0.5mm. (c) Pseudo-colored overlay image of the highlighted areas in the panel a and panel b within the squares. The microvasculature is pseudo-colored in red. The black arrow highlights the same sebaceous gland as in the panel a and its surrounding vasculatures. (d) Functional microangiography with color-coded sO2 values. The colormap was created in HSV color space, where Hue was coded by the sO2 as the color bar, Saturation and Value are coded by the intensity of the microangiography. (e) Histogram of sO2 calculated from the selected arteriole and vein in panel d.
