
Fig. 4.
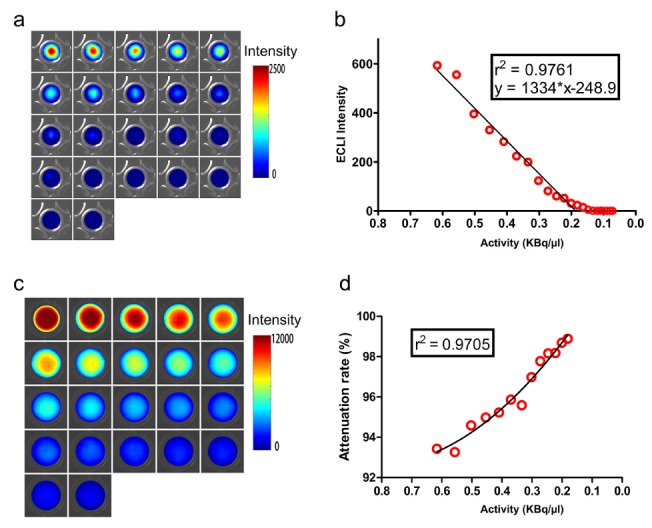
Results of the in vitro sensitivity experiment and attenuation rate study. (a) Fusion images of the in vitro sensitivity experiment; (b) Linearity analysis between the average intensity of the region of interest versus the activity of 68Ga; (c) Fusion images acquired by the traditional CLI system; (d) Linearity analysis between the attenuation rates versus the activity of 68Ga.