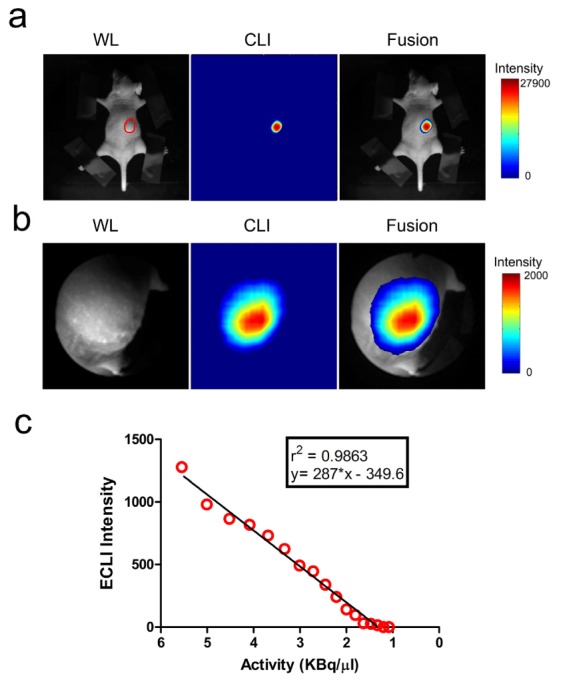
Fig. 5.

Results of the mouse-bearing pseudotumor experiment. (a) Mouse was imaged by the traditional CLI system, and the pseudotumor area is outlined in red; (b) Regional image of the pseudotumor taken by the ECLI system (pseudo-colored). Left column depicts the white-light (WL) images, the middle shows the luminescent images (CL), and the fusion images with pseudo-color are on the right; (c) Linear relationship between the average intensity of ROIs versus the activity of 68Ga for the pseudotumor experiment.
