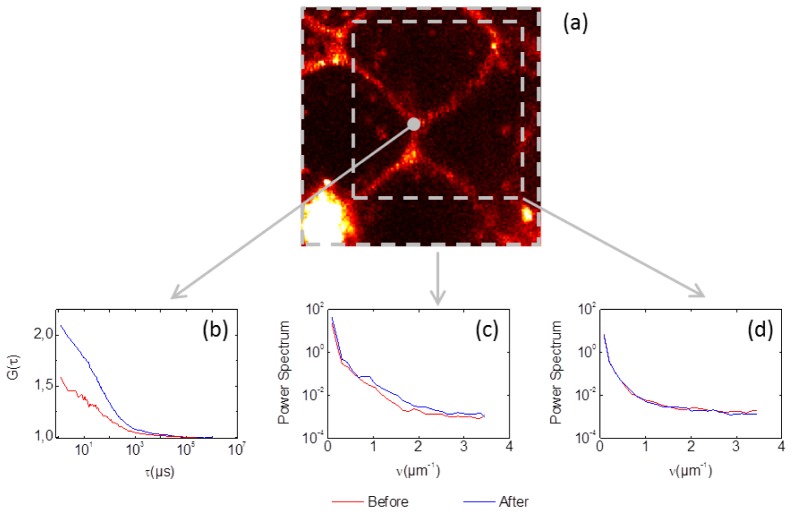
Fig. 4.
Comparison of the effects of AO, before (red) and after (blue) one AO cycle performed at one single point. (a) The 25 × 25 μm confocal image. (b) ACF curves obtained at the center of the image. (c) Radially averaged power spectrum of the entire image. (d) Radially averaged power spectrum computed over a reduced field of view (grey sub-box). The optimized mirror shape had a 75 nm RMS amplitude.

