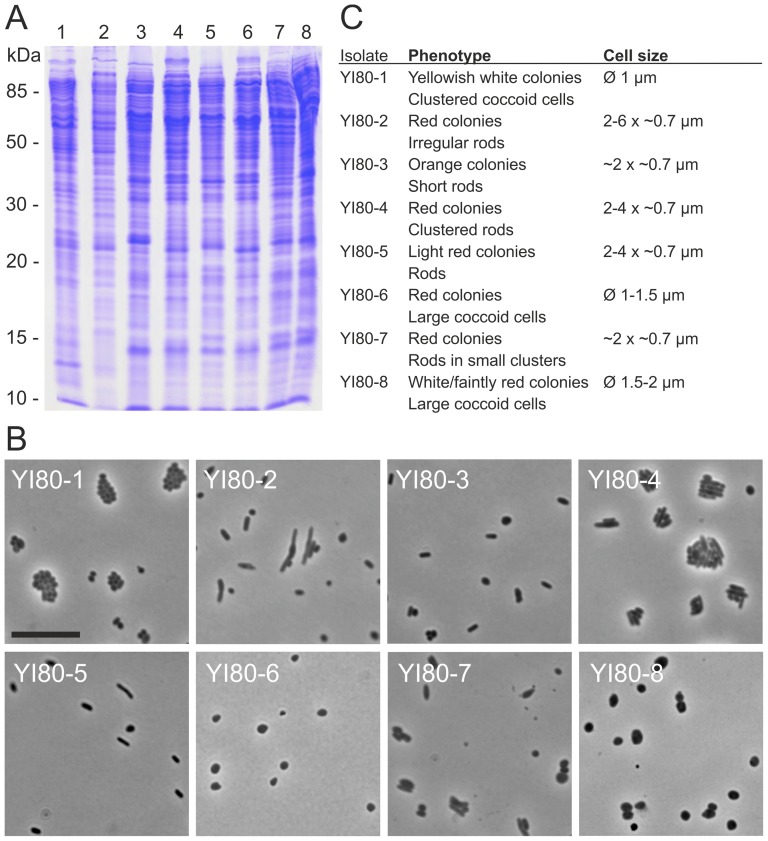
Figure 3. Microbes isolated from rock salt drill core sample from the depth of 800 m.
(A) The whole cell protein analysis of the isolates by SDS-PAGE. The numbers refer to strains YI80-1 to YI80-8. Molecular mass markers are shown on left. (B) Light microscopy pictures of the isolates in late stationary phase. The scale bar in YI80-1 represents 10 µm, and is applicable to all pictures. (C) Phenotypic characteristics of the isolates.

