. 2014 Apr 9;43(4):532–538. doi: 10.1097/MPA.0000000000000080
Copyright © 2014 by Lippincott Williams & Wilkins
This is an open-access article distributed under the terms of the Creative Commons Attribution-NonCommercial-NoDerivatives 3.0 License, where it is permissible to download and share thework provided it is properly cited. Thework cannot be changed in any way or used commercially. http://creativecommons.org/licenses/by-nc-nd/3.0.
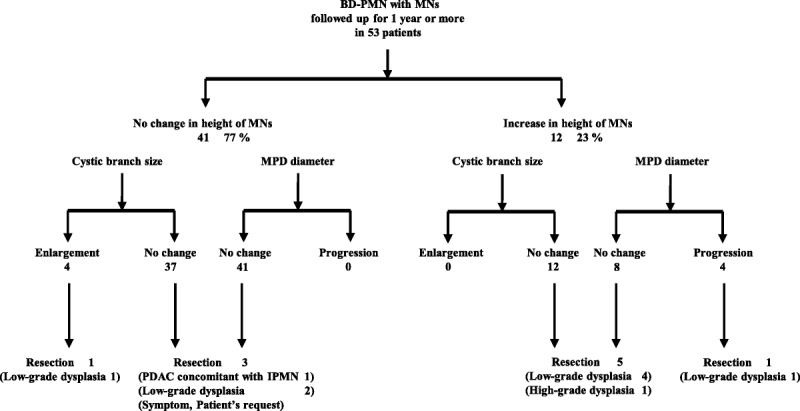
FIGURE 1.

Changes in MNs, cyst size, and MPD diameter during follow-up.
