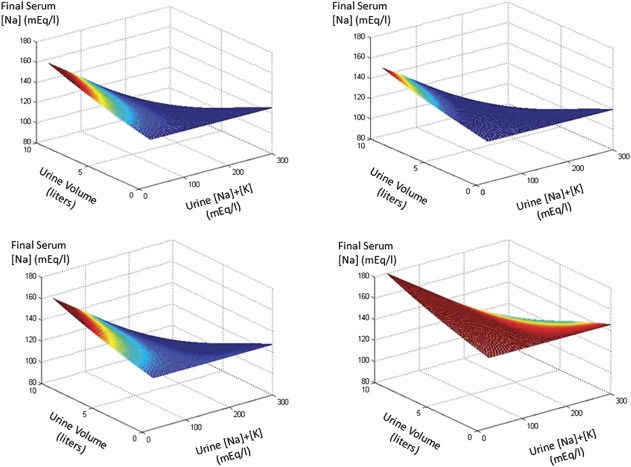
FIGURE 1.
Simulations of the response of [Na]s depending on urine flow and electrolyte content as well as infusate composition and volume. We began with a 70-kg man (42 L TBWIni) and a [Na]Ini of 125 mEq/L. Simulations are shown in 4 circumstances. Top left panel: no infusate. Top right panel: 2 L of 5% dextrose in water. Bottom left panel: 2 L of 0.9% saline. Bottom right panel: 2 L of 3% saline. Urine volume and electrolyte content were allowed to range in the x and y axes between 0 and 10 L and 25 and 300 mEq/L, respectively. We present simulations as if these occurred after 24 hours and color-coded rates of correction exceeding 20 mEq/L per 24 hours as red with lesser rates of correction having hues moving toward the blue end of the color spectrum.

