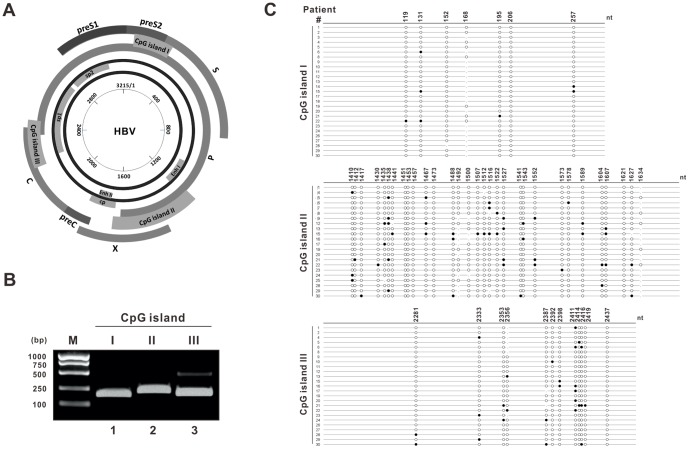
Figure 1. DNA methylation status of HBV cccDNA CpG islands in liver tissues.
(A) Schematic illustration of the localizations of CpG islands in HBV cccDNA. The inner circle shows the scale of 3.2 kb HBV circular genome with nucleotide numbers. HBV enhancer I/II, core promoter and SP1 promoter, are indicated on cccDNA. The distribution of three major CpG islands in cccDNA and the overlapped viral gene coding ORFs are depicted. (B) Ethidium bromide gel of PCR products of CpG island I (lane 2), island II (lane 3), island III (lane 4) amplified from the sodium bisulfate treated cccDNA. DL1000 (Takara) served as DNA size marker. (C) The distribution of methylated CpG sites in each CpG island from patient cccDNA samples. The black and white circles represent methylated and unmethylated CpG dinucleotides, respectively. The vertical line indicates dinucleotides other than CpG at the corresponding site. Only the samples with valid bisulfite sequencing data are included.

