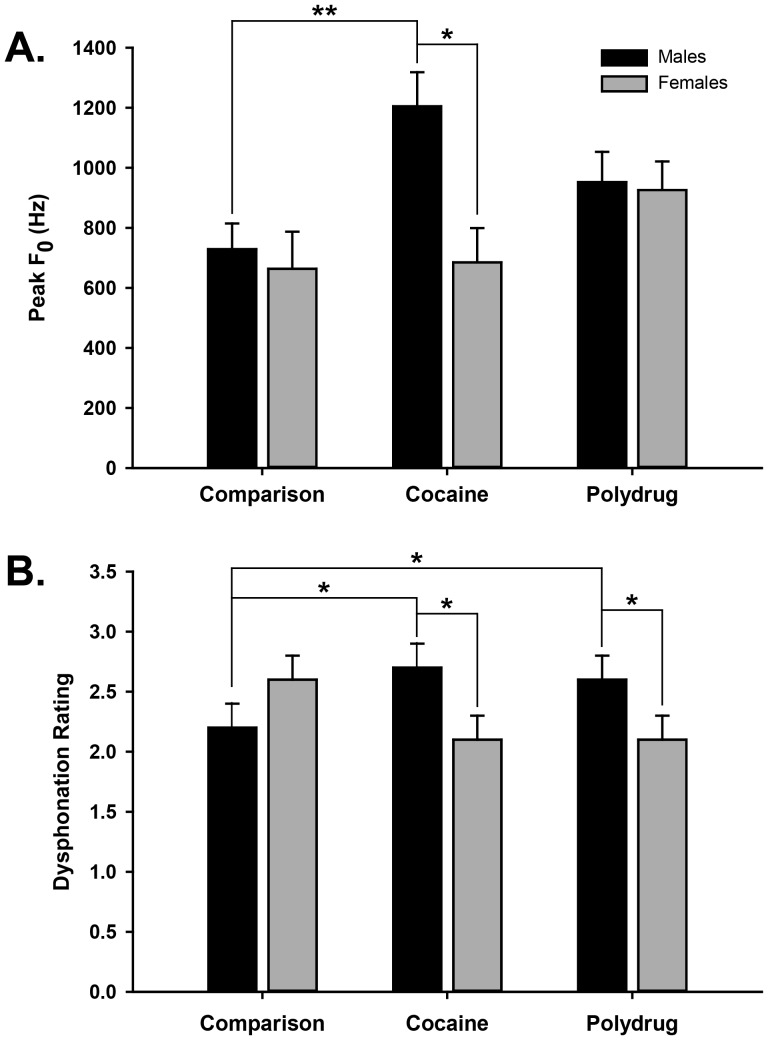
Figure 3. Means, standard errors and significant differences of (A) Peak F0 and (B) Dysphonation for male and female infants in the three exposure groups [Standard Comparison (Control), PCE (Cocaine) and PPE (Polydrug) groups].
The dysphonation score represents the mean rating on a 4-pt scale of the amount of dysphonation in each cry expiration (see text). These acoustic features comprised a cluster of cry measures that differentiated PCE males.

