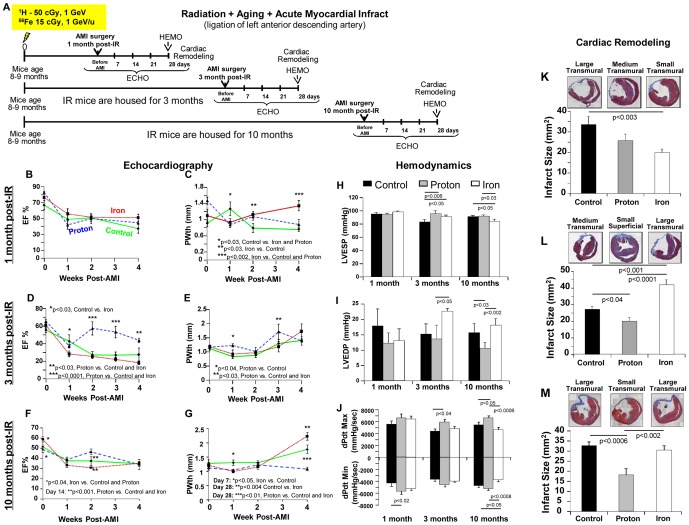
Figure 4. ECHO, HEMO Measurements of Cardiac Functions and Cardiac Remodeling in IR + Aging + AMI Model.
(A) Diagrammatic representation of the experimental design to evaluate the effect of acute, low-dose, whole body 50 cGy 1 GeV 1H and 15 cGy 1 GeV/n 56Fe IR in the hearts of 8–10 months old C57BL/6NT over 10 months in Radiation + Aging + AMI. IR-induced alterations in cardiac function were assessed by echocardiography (ECHO), hemodynamic (HEMO) and morphometric/histologic measurements and activation of signaling pathways by protein analyses. Acute myocardial infarct (AMI) was induced by ligation of the left anterior descending (LAD) coronary artery 1, 3 and 10 months post-IR, and mice were monitored over 28 days post-AMI. ECHO analysis of cardiac function in the hearts of full-body 1H-IR, 56Fe-IR and non-IR control mice 1, 3 and 10 months post-IR in IR+Aging+AMI model for: EF% 1 month (B), 3 months (D), 10 months (F), PWth (mm) 1 month (C), 3 months (E) and 10 months (G). Results in all graphs (B–G) are presented as mean ± SEM; n = 6–8 animals per time point/group. Non-IR control – solid green line, 1H-IR - dashed blue line and 56Fe-IR - dotted red line. HEMO measurements and analysis of cardiac function in the hearts of full-body 1H-IR, 56Fe-IR and non-IR control mice 1, 3 and 10 months post-IR for: (H) LV ESP (mmHg), (I) LV EDP (mmHg), (J) LV dP/dtMax and dP/dtMin (mmHg/sec). Results in all graphs (H–J) are presented as mean ± SEM; n = 6–8 animals per time point/group for non-IR control - solid black bars, 1H-IR - solid grey bars and 56Fe-IR - solid white bars. Statistical significance was assigned when P<0.05. Cardiac Remodeling 1, 3 and 10 months post-IR and 28 days after AMI: Cardiac fibrosis was measured in the heart tissue post-AMI using Masson's Trichrome staining - blue is fibrosis and dotted line indicates the infarct scar size. Measurements represent midline length of the infarct when >50% of the LV was involved (mm) and every 3rd section of the adjacent 8 µm size section were measured and infarct size was reconstructed as described before. Insets are representative images of 1H-IR, 56Fe-IR and non-IR control mice 1 month (K), 3 months (L) and 10 months (M) post-IR and 28 days after AMI. Graphic representation of the infarct size/scar (mm2) 1 month (K), 3 months (L) and 10 months (M) post-IR and 28 days after AMI. Results in all graphs are presented as mean ± SEM; N = 6–8 animals per time point/group for non-IR control - solid black bars, 1H-IR - solid grey bars and 56Fe-IR - solid white bars. Statistical significance was assigned when P<0.05.

