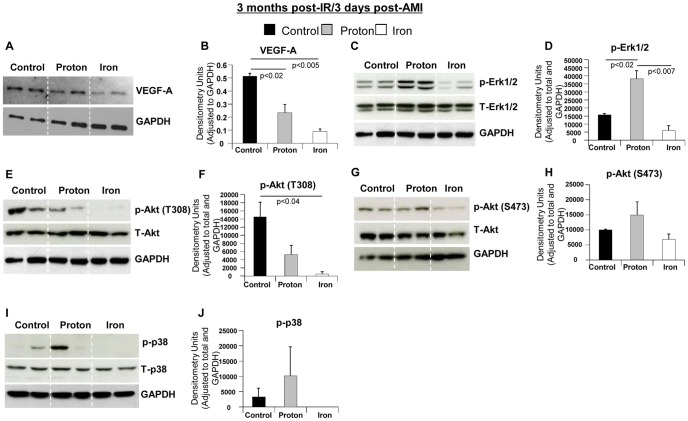
Figure 5. Molecular Pathways 3 days post-AMI in 1H-IR, 56Fe-IR and sham control hearts at 3 months post-IR.
Representative Western blot images of heart tissue homogenates from sham control, 1H- and 56Fe-IR mice at 3 months post-IR in IR+Aging+AMI model. Images represent phosphorylated (p), total (T) and loading control for the following proteins (A) VEGF-A and GAPDH, (C) p-Erk1/2, T-Erk1/2 and GAPDH, (E) p-Akt (T308), T-Akt and GAPDH, (G) p-Akt (S473), T-Akt and GAPDH, (I) p-p38, T-p38 and GAPDH. Quantification and graphic representation of total protein levels and phosphorylation using densitometric analysis of phospho-band intensities after adjusting for corresponding GAPDH/β-actinin and total band intensities of heart tissue homogenates at 3 months post-IR and 3 days after AMI for the following proteins - (B) VEGF-A, (D) p-Erk1/2, (F) p-Akt (T308), (H) p-Akt (S473), (J) p-p38. Results in all graphs are depicted as mean ± SEM values and represent a pooled data from n = 6–8 animals per time point/group for non-IR control (solid black bars), 1H-IR (solid grey bars) and 56Fe-IR (solid white bars) groups. Statistical significance was assigned when P<0.05.

