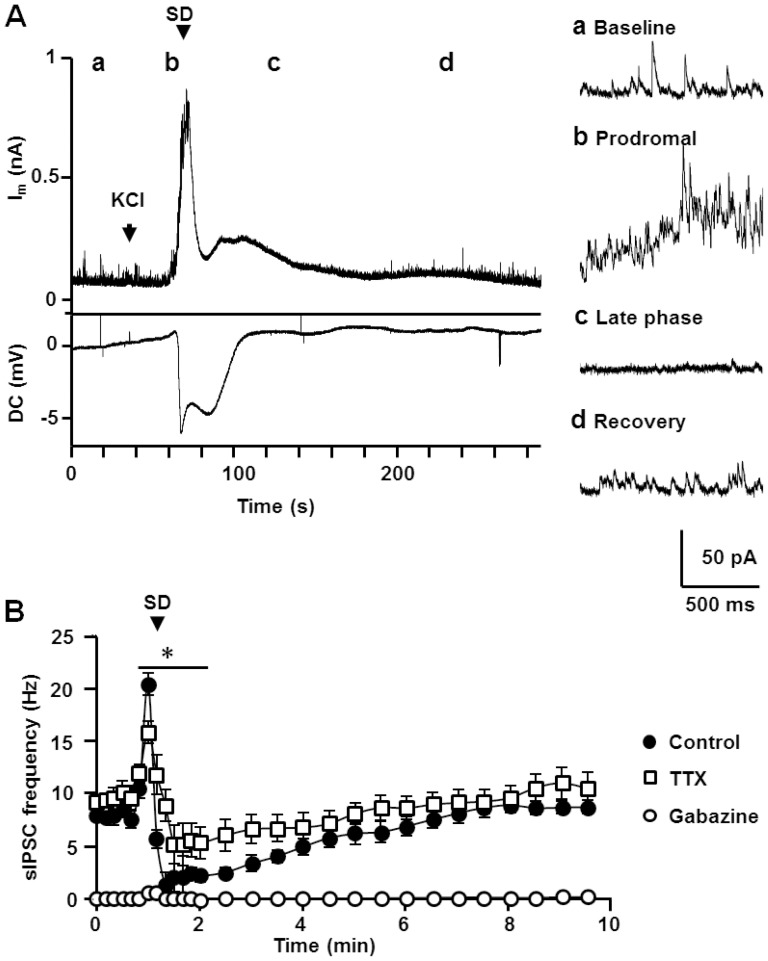
Figure 1. Characterization of sIPSC during SD.
A. A representative recording of whole-cell current (Im, top) and DC potential (DC, bottom) during SD. Whole-cell recordings were made at 0 mV to isolate GABAAR mediated sIPSC. Right insets shows expanded spontaneous events during the periods indicated by a-d. The SD onset is defined by the onset of extracellular DC shift and is indicated by the arrow. There was a significant elevation of sIPSC frequency prior to SD arrival (b, Prodromal phase), followed by a transient suppression (c, late phase). B. Plots of mean sIPSC frequencies during SD are presented. Mean sIPSC frequency were calculated from 10 s bins during the initial 2 minutes, and later from 30 s bins. The arrow indicates the bin accompanying the onset of extracellular DC shift. Gabazine 10 µM (open squares) nearly completely eliminated sIPSC detection, and TTX 1 µM (open circle) decreased the initial sIPSC frequency increase as well as the degree of suppression. Note near complete elimination of sIPSC detection in the presence of gabazine (open squares). Statistical tests were performed between control and TTX. Control n = 9, Gabazine n = 6, TTX n = 7. *p<0.05, Control vs. TTX.

