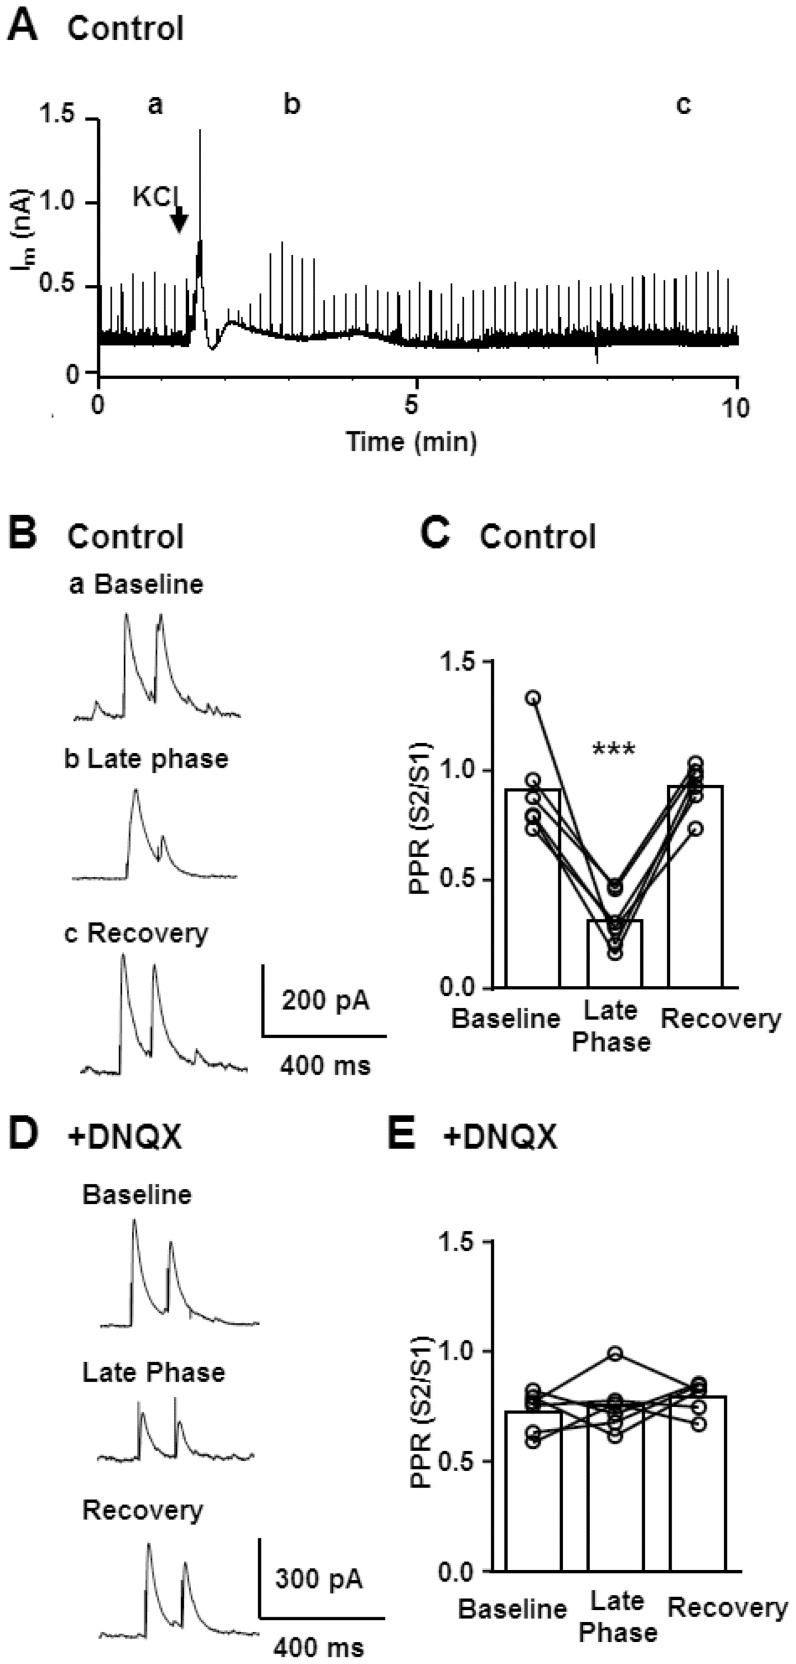
Figure 3. Characterization of paired pulse ratio (PPR) of evoked IPSC during SD.
A-C. Characterization of PPR in control conditions. Pairs of IPSC (100 ms pulse interval, 0.1 Hz) were continuously evoked throughout whole-cell recordings of SD, and the PPR in different phases of SD were analysed. In the representative trace (A) evoked IPSCs are represented as sharp vertical lines. B. Single evoked IPSC pairs at corresponding time points are presented at an expanded time scale (a-c). Note the change in paired-pulse ratio as well as slow kinetics of IPSC during late phase (b). C. Quantitative analysis of PPR during control, SD late phase and following full recovery. ***p<0.005, n = 6. D&E The same experiments were conducted in the presence of the AMPA receptor antagonist DNQX (20 µM) to isolate monosynaptic components. D. Representative IPSCs are shown. Note that DNQX nearly completely abolished PPR changes during the late phase. E. Quantitative analysis of PPR changes. There was no significant change in PPR of monosynaptic IPSCs. n = 6.

