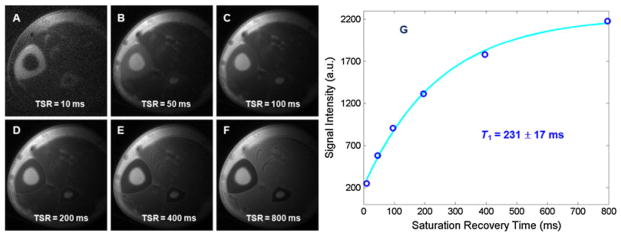
Figure 11.

Saturation recovery ultrashort-TE (UTE) imaging of the tibia of a volunteer with saturation recovery times (TSR) of 10 ms (A), 50 ms (B), 100 ms (C), 200 ms (D), 400 ms (E) and 800 ms (F). Mono-exponential fitting shows a short T1 of 231 ± 17 ms (G) for cortical bone. The total T1 quantification time was 14 min. From ref. (59), with permission.
