
Figure 12.
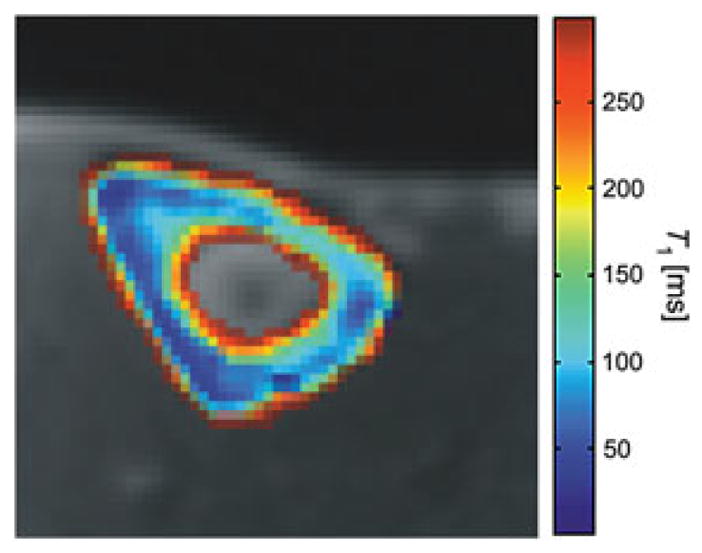
A pixel-by-pixel calculated map of the longitudinal relaxation times of the tibial cortical bone of a healthy volunteer. From ref. (71), with permission.
Official websites use .gov
A
.gov website belongs to an official
government organization in the United States.
Secure .gov websites use HTTPS
A lock (
) or https:// means you've safely
connected to the .gov website. Share sensitive
information only on official, secure websites.
A pixel-by-pixel calculated map of the longitudinal relaxation times of the tibial cortical bone of a healthy volunteer. From ref. (71), with permission.