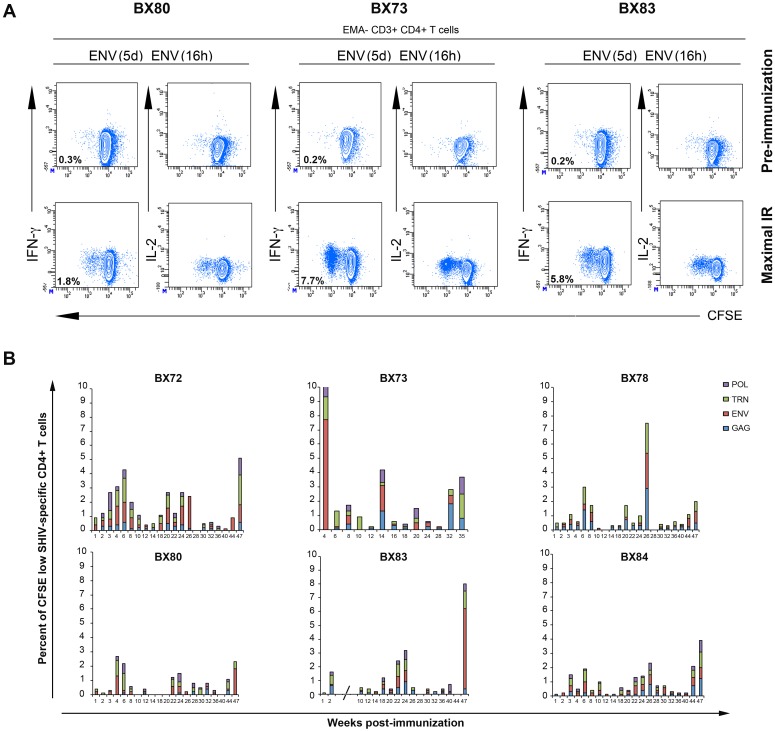
Figure 3. SHIV-specific CD4+ T cell recall responses.
PBMCs were processed and labeled using the procedure described in the legend of Figure 2. A) Flow cytometry data analyses were performed by gating on low FSC/SSC, EMA-, CD3+ and CD4+ T cell populations (colored in blue). Representative results obtained for macaques BX73, 80 and 83 at the pre-immunization time point and at the time of maximal immune response (IR) for Env antigen are displayed. Frequencies for Env-specific responses are reported as the percent of proliferating CD4+ T cells after the subtraction of backgrounds obtained with cells cultured for 5 days with medium alone and restimulated for 6 h with relevant peptides pools. B) Summary of the frequency of proliferating (CFSE low) CD4+ T cells detected against each indicated antigen (Gag (blue), Env (red), TRN (green), Pol (purple)) in each immunized animal (BX72, 73, 78, 80, 83, 84) following weeks post-immunization. Of note, results obtained between W3 and W8 for BX83 were excluded due to non-specific T cell hyperactivation (indicated by an interrupted x-axis).

