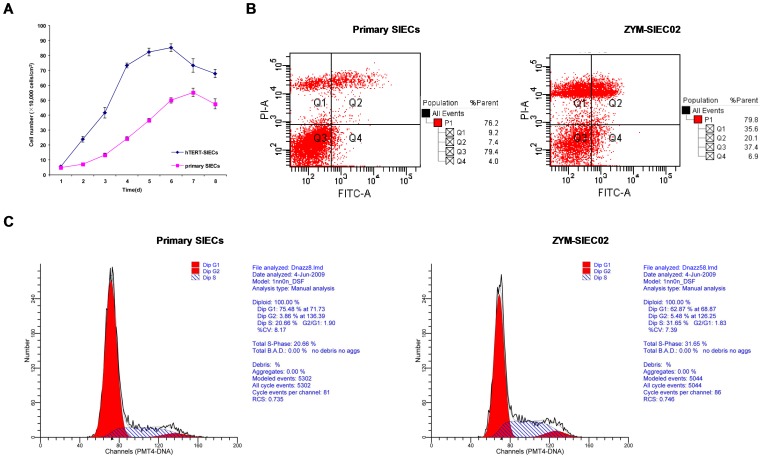
Figure 3. Growth curves, apoptosis and cell cycle analysis of SIECs before and after hTERT transfection.
A. Growth of pSIECs and ZYM-SIEC02 cells. Data are represented as the mean ± SD of 3 independent experiments. B. Apoptosis analysis of control pSIECs and ZYM-SIEC02 cells, The percentage of apoptosis in pSIECs and ZYM-SIEC02 cells under basal growth conditions was 26.9% and 11.4% (Q2+Q4), respectively. C. Cell cycle distributions of control SIECs and ZYM-SIEC02 cells, the percentages of pSIECs and ZYM-SIEC02 cells in S phase were 20.66% and 31.65%, respectively.

