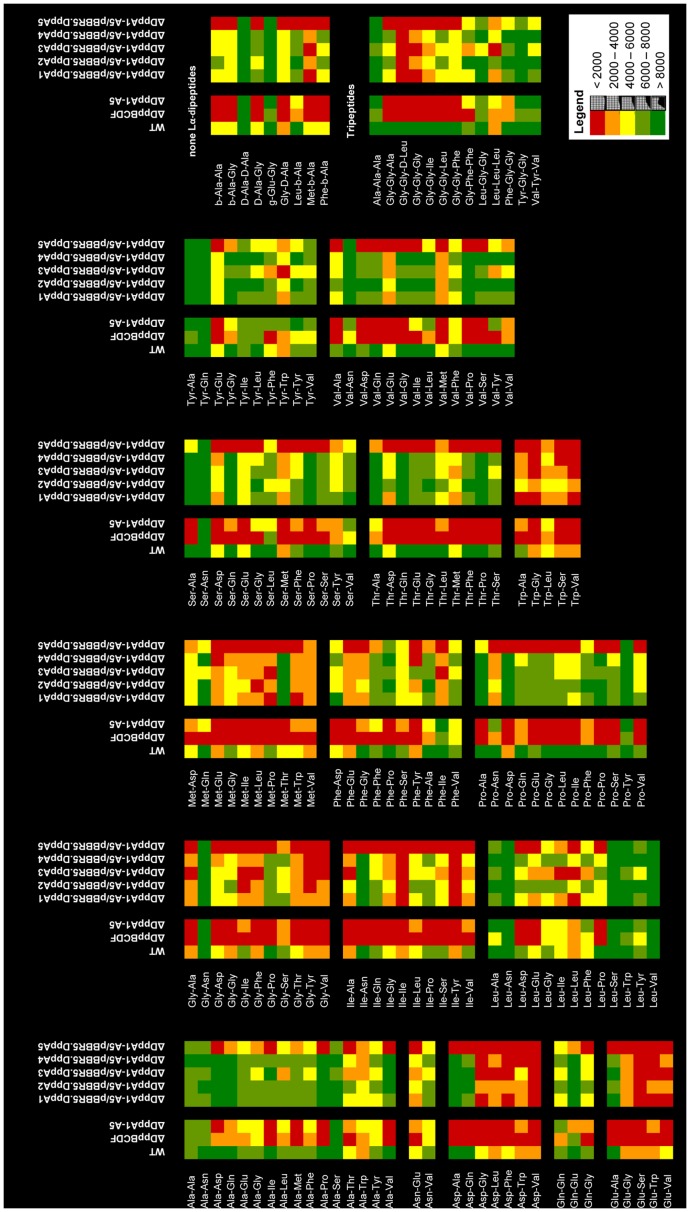
Figure 4. Heat map of di/tripeptide utilization by PA14, the DppBCDF transporter mutant, the SBP penta mutant DppA1–A5, and by strains of the penta mutant complemented with individual SBPs.
Each square represents the average respiratory activity of a strain in one well of the Biolog Phenotype MicroArray plates. The heat map is based on the values reflecting the extent of respiration after 24 hours at 37°C. Values exceeding 8000 reflect solid respiratory activity during the assay. Values below 2000 were considered as no respiratory activity.

