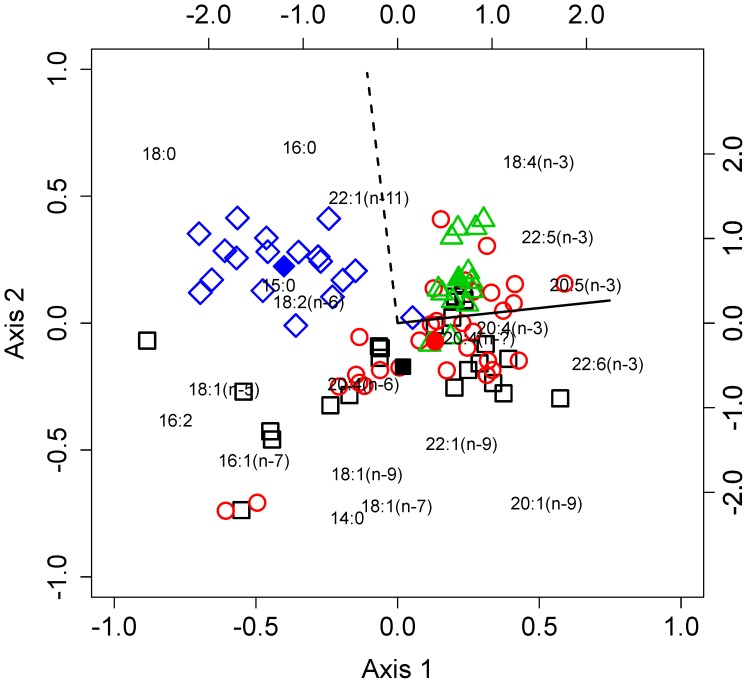
Figure 4. Redundancy analysis distance triplot of the phospholipid fatty acid data from 85 individual C. acutus (‘sites’) using 20 fatty acids (‘species’).
The effects of depth and temperature are plotted as vectors (solid- and dashed lines respectively). Symbols and colours denote Station identity, with the overall effect of each Station being represented by filled symbols. The primary and secondary sets of axes relate to the sites and species loadings respectively.

