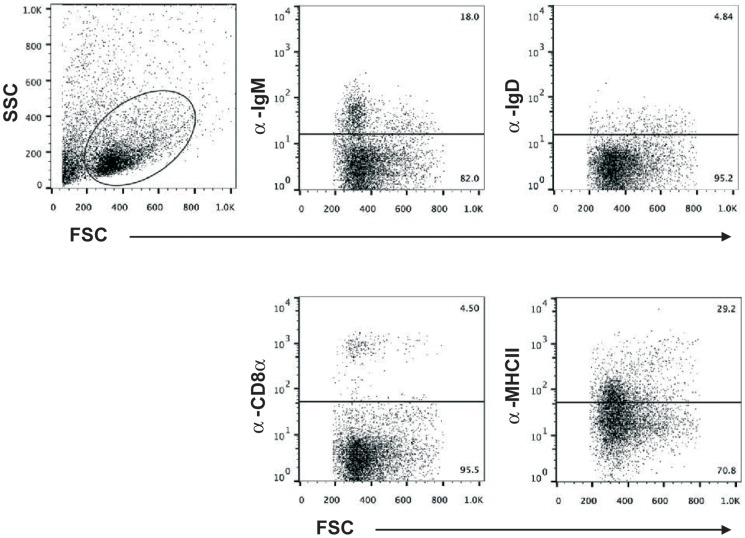
Figure 2. Flow cytometry analysis of leukocyte populations in trout liver.
Distribution of leukocyte cells in rainbow trout liver tissue. Flow cytometry of rainbow trout liver leukocytes stained with anti-IgM, anti-IgD, anti-CD8α, and anti-MHC-II mAbs. First dot plot shows SSC/FSC profile of liver leukocytes. Subsequent plots show fluorescence intensity versus FSC of the gated cells.

