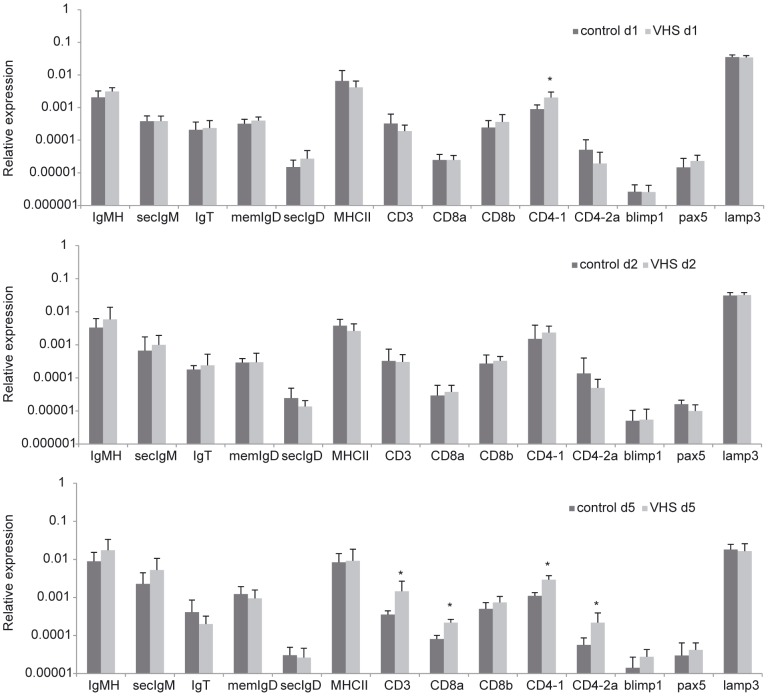
Figure 3. Transcription levels of immune genes characteristic of different leukocyte subpopulations in liver in response to VHSV.
Rainbow trout were ip. infected with VHSV (5×10⁵ TCID50/ml) or mock-infected. At days 1, 3 and 5 post-infection six trout from each group were killed and the liver sampled to determine the levels of expression of a selection of immune genes by real-time PCR. Data are shown as the mean gene expression relative to the expression of endogenous control EF-1α ± SD. * Levels of expression significantly different to those observed in mock-infected fish (p<0.05).

