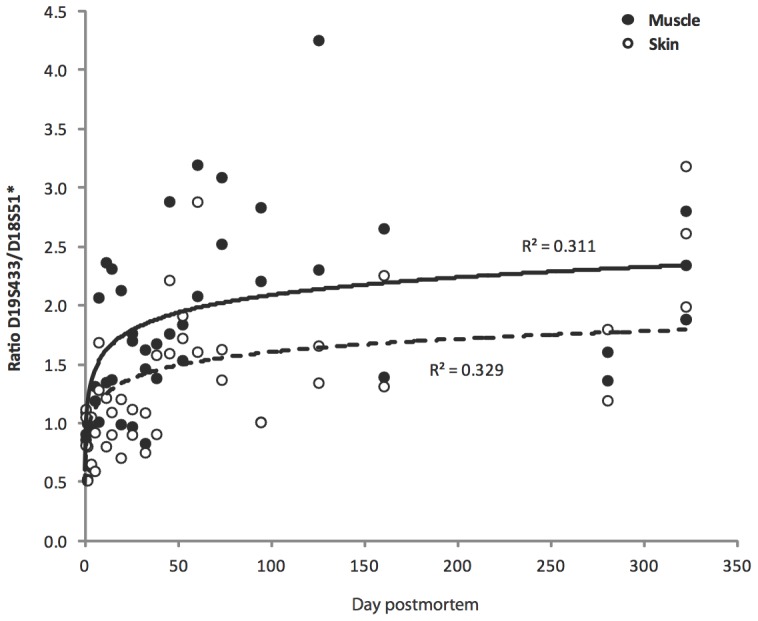
Figure 3. The change of the peak height ratio of the shorter D19 locus (sum of the peak heights of alleles 13 and 14) relative to the longer D18 locus (peak height of homozygous allele 15) within the DNA profiles of muscle and skin samples during the 322 days of salt desiccation.

For both tissues, the line of best fit for the change in the peak height ratio through time is logarithmic, with lower ratios observed for skin.
