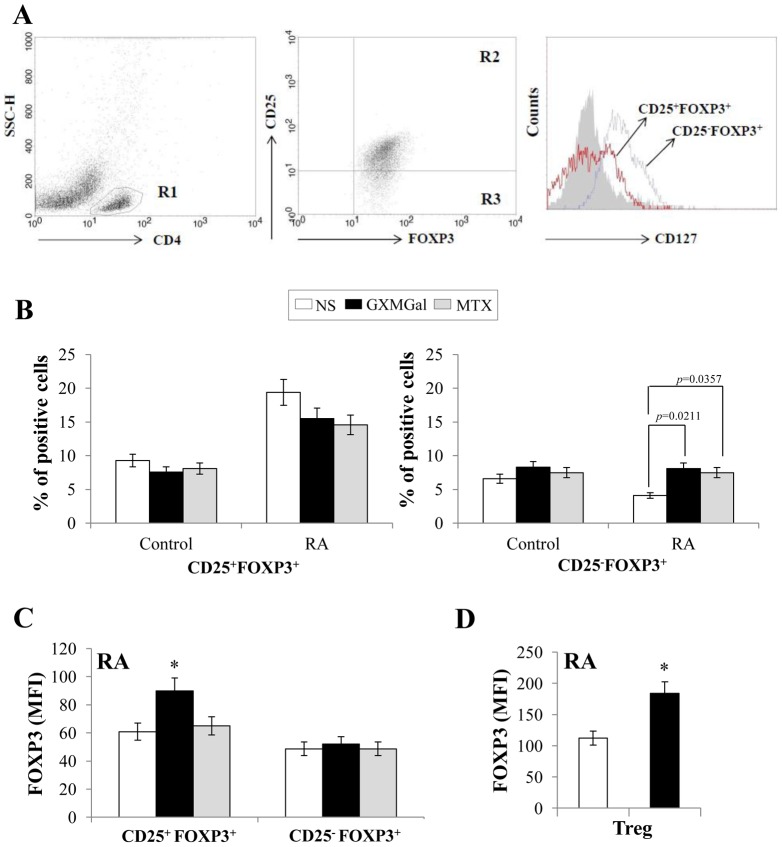
Figure 2. GXMGal effect on different subsets of Treg cells.
Activated PBMC (1×10⁶/ml) from Control and RA were incubated for 2 h in the presence or absence (NS) of GXMGal (10 µg/ml) or MTX (10 ng/ml). After incubation, cells were stained for cell surface expression of CD4, CD25 and CD127 and then intracellular stained for FOXP3. During the acquisition step a population of PBMC enriched of CD4+ T cells was obtained. For analysis, the CD4+ lymphocytes were gated on PBMC (based on side light scatter and CD4 staining: R1) and analyzed for CD25 and FOXP3 expression (CD25+FOXP3+: R2 and CD25−FOXP3+: R3). The expression of CD127 was shown as FACS histograms in R2 and R3 cells. The gating strategy was shown (A). The percentage of CD25+FOXP3+ and CD25−FOXP3+ cells are shown as mean ± SEM of ten independent experiments. p = 0.0211 (triplicate samples of 10 different Control and RA; RA GXMGal-treated vs untreated cells); p = 0.0357 (triplicate samples of 10 different Control and RA; RA MTX-treated vs untreated cells (B). The mean of fluorescence intensity (MFI) of FOXP3 in CD25+FOXP3+ and CD25−FOXP3+ cells (C) or magnetically purified Treg (D) from RA after 18 h of GXMGal or MTX treatment was shown as mean ± SEM of five independent experiments. *, p<0.05 (triplicate samples of 5 different RA; RA GXMGal-treated vs untreated cells).

