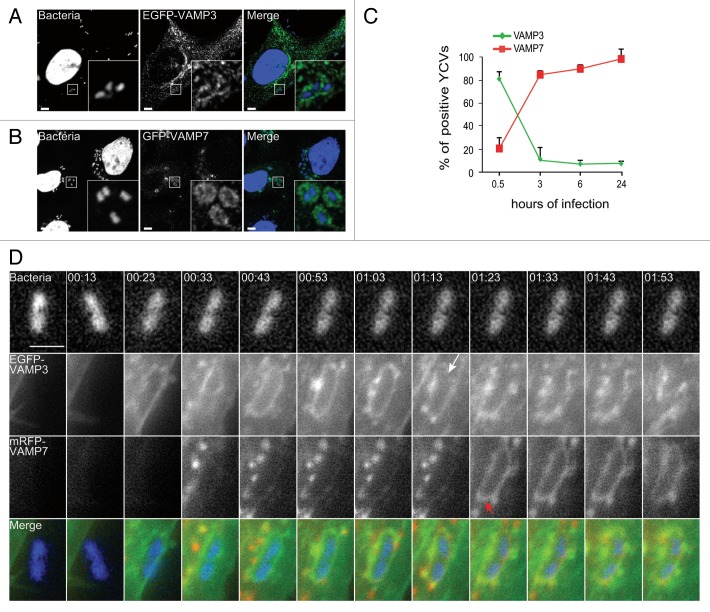
Figure 3. VAMP3 and VAMP7 associate with YCVs. (A) HeLa cells transiently expressing an EGFP-VAMP3 chimera were infected with Y. pseudotuberculosis for 45 min and then processed for CLSM. Bacteria (blue) are contained in EGFP-VAMP3-positive vacuoles. Scale bar: 5 µm. Insert magnification: 5×. (B) HeLa cells transiently expressing a GFP-VAMP7 chimera were infected with Y. pseudotuberculosis for 4 h and then processed for CLSM. Bacteria (blue) are contained in mRFP-VAMP7-positive vacuoles. Scale bar: 5 µm. Insert magnification: 5×. (C) A time-series acquisition of VAMP3 and VAMP7 proteins on YCVs during infection. Data represent average percentages of YCVs positive for the considered protein (in 3 independent experiments and after the analysis of 50 transfected, infected cells per experiment). (D) HeLa cells transiently expressing EGFP-VAMP3 (green) and mRFP-VAMP7 (red) were infected for 3 h and 33 min with Y. pseudotuberculosis. Bacteria were stained with DAPI (DNA, blue). Panels show series of images from Video S1 showing the migration of EGFP-VAMP3 and mRFP-VAMP7 proteins around a YCV. The white arrow indicates dissociation of VAMP3 from the YCV. Red arrows indicate VAMP7 vesicles heading to fusion with the YCV. At 1:23, the YCV displays VAMP7 on its surface as a result of these fusions. Acquisition times are indicated in the lower left corner (h:min). Scale bar: 5 µm.

An official website of the United States government
Here's how you know
Official websites use .gov
A
.gov website belongs to an official
government organization in the United States.
Secure .gov websites use HTTPS
A lock (
) or https:// means you've safely
connected to the .gov website. Share sensitive
information only on official, secure websites.
