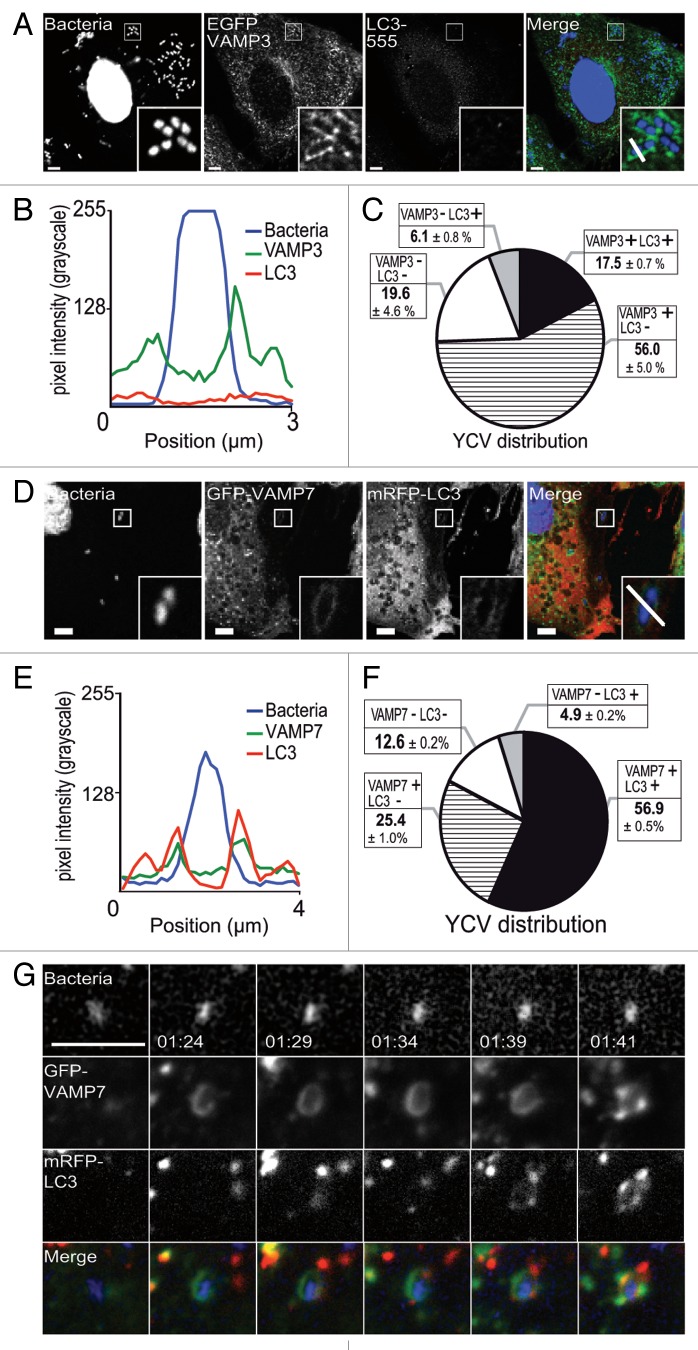
Figure 4. YCV vacuoles harbor LC3 and SNARE proteins. (A) HeLa cells transiently expressing an EGFP-VAMP3 chimera were infected with Y. pseudotuberculosis for 30 min and then processed for CLSM. Bacteria (blue) are contained within EGFP-VAMP3-positive and LC3-AlexaFluor® 555-negative vacuoles. Scale bar: 5 µm. Insert magnification: 4×. A fluorescence scan along the white line in the insert in the merged panel is shown in (B). (C) A pie chart displaying the distribution of bacteria as a function of EGFP-VAMP3 and LC3-AlexaFluor® 555 labeling. In each experiment, at least 50 infected cells were quantified in a double-blind analysis. Values are quoted as the mean ± SEM from at least 3 independent experiments. (D) HeLa cells transiently expressing GFP-VAMP7 proteins were infected with Y. pseudotuberculosis for 4 h and then processed for CLSM. Bacteria (blue) are contained in GFP-VAMP7-positive and mRFP-LC3 negative vacuoles. Scale bar: 5 µm. Insert magnification: 4×. A fluorescence scan along the white line in the insert is shown at the bottom (E). (F) A pie chart displaying the distribution of bacteria as a function of GFP-VAMP7 and mRFP-LC3 labeling. In each experiment, at least 50 infected cells were quantified in a double-blind analysis. Values are quoted as the mean ± SEM from at least 3 independent experiments. (G) HeLa cells transiently expressing GFP-VAMP7 (green) and mRFP-LC3 (red) were infected with Y. pseudotuberculosis for 2 h. Cells were stained with DAPI (DNA, blue). Panels show series of images from Video S2. Acquisition times are indicated in the lower left corner (h:min). Scale bar: 5 µm.

An official website of the United States government
Here's how you know
Official websites use .gov
A
.gov website belongs to an official
government organization in the United States.
Secure .gov websites use HTTPS
A lock (
) or https:// means you've safely
connected to the .gov website. Share sensitive
information only on official, secure websites.
