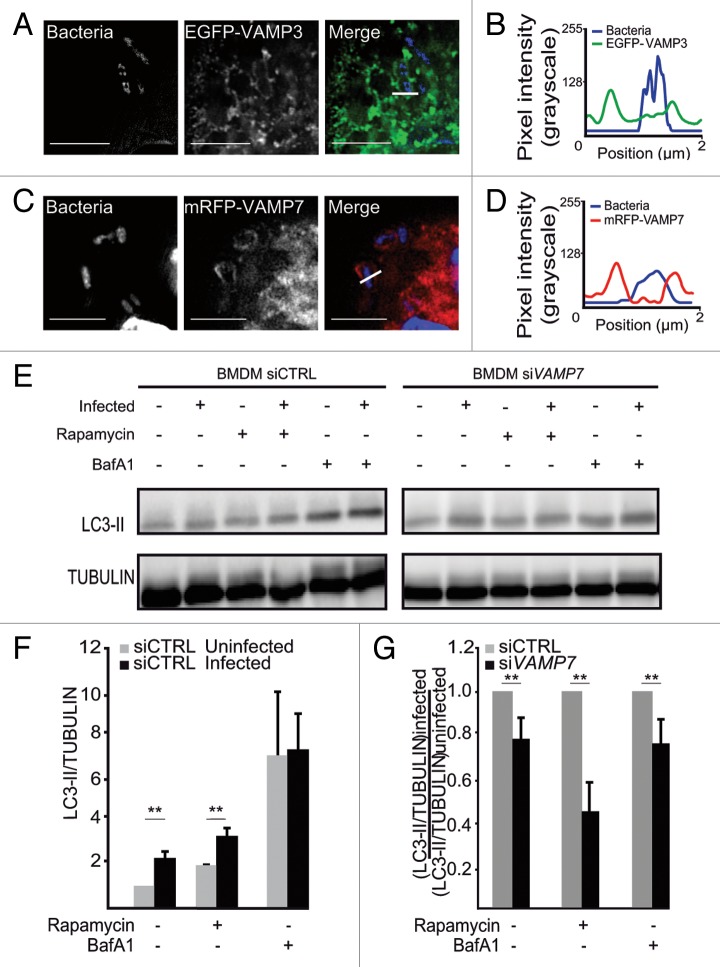
Figure 6. VAMP3 and VAMP7 are recruited to YCVs in macrophages and VAMP7 is involved in LC3 recruitment. (A) BMDMs transiently expressing EGFP-VAMP3 were infected with Y. pseudotuberculosis for 30 min and then processed for super resolution fluorescence analysis (structured illumination microscopy- SIM). Bacteria were visualized after staining with DAPI. Scale bars: 5 µm. The fluorescence profile along the white line of the image insert is shown in the lower left corner (B). (C) BMDMs transiently expressing mRFP-VAMP7 were infected with Y. pseudotuberculosis for 3 h and then processed for SIM. Bacteria were visualized after staining with DAPI. Scale bars: 5 µm. The fluorescence profile along the white line in the image insert is shown at the bottom left (D). (E) BMDMs transfected with control (siCTRL) or VAMP7 siRNA were analyzed for LC3 by immunoblotting. The cells were treated with rapamycin or BafA1 as indicated and DMSO was used as a solvent control. Protein loading was checked against the α-tubulin (TUBA) content. The complete data set is shown in Figure S2D. (F) The LC3-II/TUBULIN ratio for BMDMs treated with control siRNA (siCTRL) as a function of cell treatment or infection. The mean of 3 independent experiments is indicated and the error bars correspond to the SEM (G) ([LC3-II/TUBULIN]infected)/([LC3-II/TUBULIN] uninfected) ratio in BMDMs treated with control siRNA (siCTRL) or siRNA against VAMP7 (siVAMP7) cells as a function of treatment with rapamycin or BafA1. The mean of 3 independent experiments is indicated and the error bars correspond to the SEM.

An official website of the United States government
Here's how you know
Official websites use .gov
A
.gov website belongs to an official
government organization in the United States.
Secure .gov websites use HTTPS
A lock (
) or https:// means you've safely
connected to the .gov website. Share sensitive
information only on official, secure websites.
