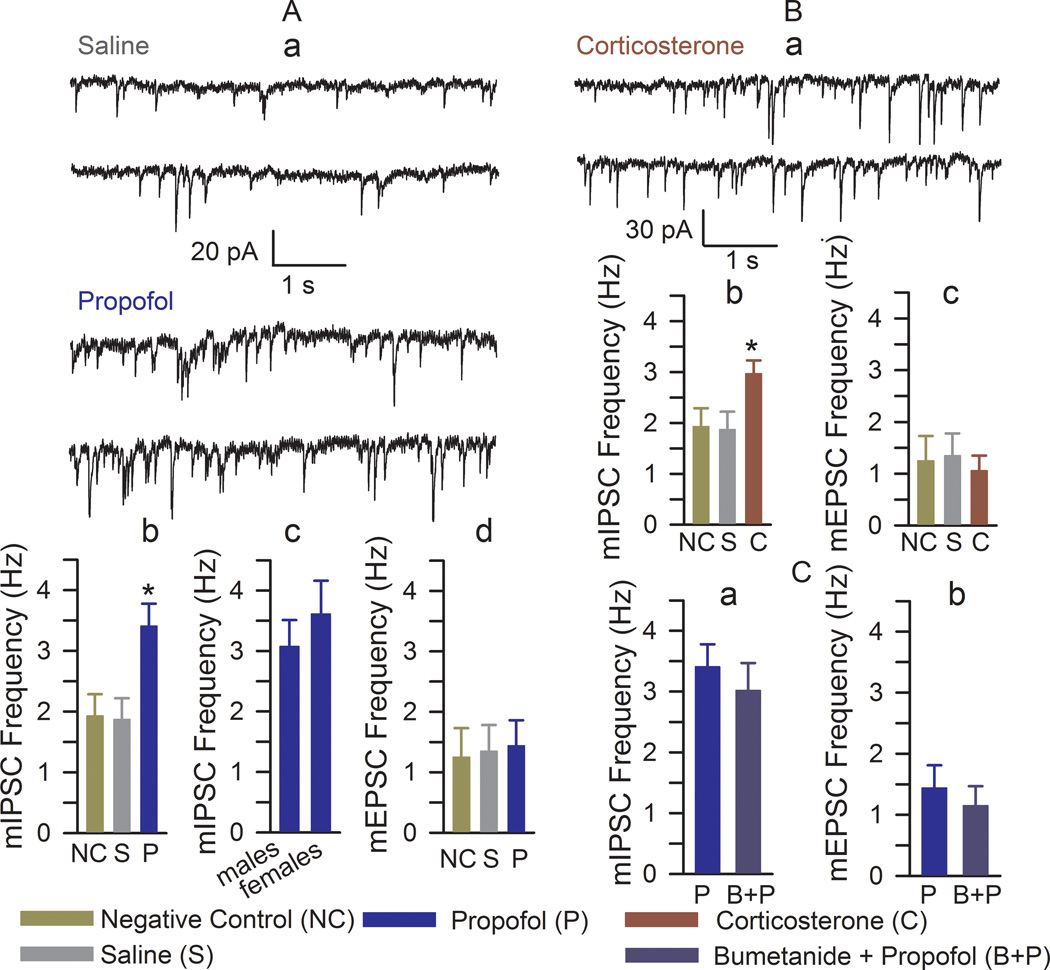
Figure 2.
Anesthesia of postnatal days (P) 4, 5, or 6 rats with propofol induced an increase in the frequency of miniature inhibitory postsynaptic currents (mIPSCs). (A,a) Examples of mIPSC recordings in hippocampal CA1 neurons of the >P80 rats that were treated at P4–P6 with saline or propofol. (A,b and A,d) Histograms showing the frequencies of mIPSCs and miniature excitatory postsynaptic current (mEPSCs) in hippocampal CA1 neurons of the >P80 rats. Number of recorded cells for each treatment group: negative control (9), saline (8), and propofol (13). *P < 0.05 vs. all other treatment groups. (A,c) Histograms showing the frequencies of mIPSCs in hippocampal CA1 neurons of the male (n=5) and female (n=9) rats treated with propofol. (B,a) Examples of mIPSC recordings in hippocampal CA1 neurons of the >P80 rats that were treated at P4–P6 with corticosterone (0.2 mg/kg, intraperitoneally). (B,b and B,c) Histograms showing frequencies of mIPSCs and mEPSCs in hippocampal CA1 neurons of the >P80 rats. Number of recorded cells for each treatment group: negative control (9), saline (8), and corticosterone (10). The rats in the negative control and saline groups were the same as those in Fig. 2A,b,d. *P < 0.05 vs. all other treatment groups. (C) Histograms showing frequencies of mIPSCs (a) and mEPSCs (b) in hippocampal CA1 neurons of the >P80 rats pretreated with bumetanide (1.82 mg/kg, intraperitoneally) 15 min prior to induction of anesthesia with propofol. Number of recorded cells for each treatment group: propofol (n=13) and bumetanide plus propofol (n=7). The rats in the propofol group were the same as those in Fig. 2A.

