Abstract
We investigated the possibility of inter-residue communication of side chains in barstar, an 89 residue protein, employing mutual information theory. The normalized mutual information (NMI) of the dihedral angles of the side chains was obtained from all-atom molecular dynamics simulations. The accumulated NMI from an explicit solvent equilibrated trajectory (600-ns) with free backbone exhibits a parabola–shaped distribution over the inter–residue distances (0 ~ 36 Å): smaller at the end regimes but larger in the middle regime. This analysis, plus several other measures, does not find unusual long-range communication for free backbone in explicit solvent simulations.
Keywords: long-range residue communication, information theory, mutual information, molecular dynamics simulation, explicit/implicit solvent model
INTRODUCTION
The degree to which residues in a protein have specific correlated motion is a question recently investigated by mutual information1-3 and dynamical cross correlation map (DCCM)4-5 methodology. For example, long-range intra-protein communication of mutual information between side chains of barstar (PDB code: 1A19)6 and calmodulin has recently been reported employing Monte Carlo simulation with fixed backbone and implicit solvent2. Strikingly, the averaged mutual information per pair was reported to be significant at long-range for both proteins. For example, the averaged mutual information shows peaks at 6 Å and 22 Å in barstar and 6 Å and 60 Å in calmodulin.
In this communication, we employed molecular dynamics (MD) simulations of 600-ns sampling time under three conditions to sample conformations of the side chains in barstar: i) with free backbone in explicit solvent, ii) with fixed backbone in implicit solvent, and iii) with fixed backbone in explicit solvent.
MATERIALS AND METHODS
We performed simulations of the barstar (PDB code: 1A19, C82A mutant) employing the NAMD 2.8 package7 with the CHARMM 22 force-field8 for which the protein parameters incorporate the CMAP terms9. The TIP3P water (no. of water molecules = 8,225) model10 provided explicit solvent. Positions for Na+ and Cl− ions were generated with a condition of 5 Å between ions employing the AUTOIONIZE module of VMD11 in order to approximate 150 mM in NaCl. We performed energy minimization over 20,000 steps by the conjugate gradient method. Subsequently, the system was heated to 310 K over 60 ps. The particle mesh Ewald (PME) method12 was used for electrostatic interactions. The damping coefficient was 5 ps−1 for Langevin dynamics and the non-bonded cutoff was 12 Å, with switching at 10 Å. The simulation was performed with a 2 fs time interval. Molecular dynamics simulations in the NPT ensemble (310 K, 1 atm) in explicit solvent were performed for over 100 ps with fixed backbone. MD simulations in the NPT ensemble (10 ns) were then performed with/without fixed backbone. Constant pressure (1 atm) was maintained by the Langevin piston method13. Finally, the NVT ensemble simulations were performed for 620 ns without constraint on the protein. The production data (600 ns) was collected after the first 20 ns. The simulation in the implicit solvent with fixed backbone was performed in the same manner but with a dielectric constant of 78.5and employing the Generalized-Born model built in NAMD 2.8 package7. Mutual information is defined as
| (1) |
where H(X), H(Y) are Shannon entropies of random variables X and Y, and H(X;Y) is the joint entropy. In this study, H(X), H(Y), and H(X;Y) are interpreted as
| (2) |
where R is the gas constant, and x and y are the discrete states (binned dihedral angles) of the random variables X and Y (side chains of residues). The p(x) and p(y) are the associated marginal probabilities, and p(x,y) is the joint probability1.
We obtained the normalized mutual information (NMI) for dihedral angles for the side chains of barstar, including all sp3-sp3 angles: χ1, χ2, χ3, χ4, and χ5. The dihedral angles (−180°~180°) were distributed in 18 degree angle bins. The quantity NMI(X;Y) per angle pair (X, Y) is defined as (MI(X;Y)–ε(X;Y))/H(X;Y)14. ε(X;Y) is the expected error generated from the finite sampling for the estimation of the mutual information1,14. For the NMI per residue pair (i, j), NMI(i;j), we divide the summed NMI(X;Y) per angle pair for available angle pairs by the number of angle pairs contributing.
RESULT AND DISCUSSION
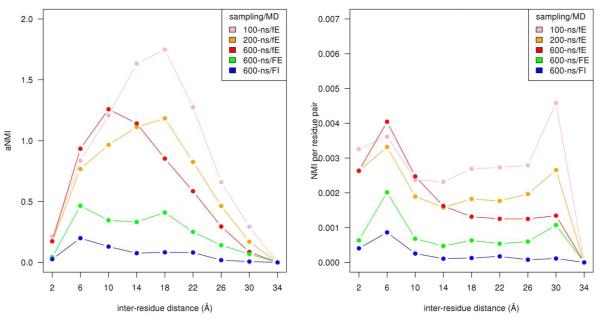
Figure 1A shows the accumulated NMI(i,j) (aNMI) from statistical sampling of a 600-ns MD simulations for several conditions. The NMI per residue pair was accumulated in 4.0 Å (Cα–Cα) distance bins. Sampling was also done for 100 and 200-ns subsets of the 600-ns MD simulation for the free backbone, explicit solvent case. The aNMI for the conventional MD (600-ns) in explicit solvent with free backbone initially increases proportional to the inter–residue distance with the maximum value ~ 10 Å and then decreases as the inter–residue distance increases. On the other hand, the aNMI for the case of implicit solvent with fixed backbone, the conditions of Ref. 2, shows two differences compared to the aNMI in explicit solvent with free backbone : i) the value of the aNMI is significantly smaller, ii) the maximum value occurs ~ 6 Å (rather than ~ 10 Å) and then generally decreases thereafter. The aNMI for the case of fixed backbone in explicit solvent fits neatly between the free backbone in explicit solvent (600-ns) and fixed backbone in implicit solvent.
Figure 1.
(A) The bin-accumulated normalized mutual information (aNMI), for three different samplings employing 600-ns MD simulations: i) free backbone in explicit solvent (red, fE), ii) fixed backbone in explicit solvent (green, FE), and iii) fixed backbone in implicit solvent (blue, FI). Also included, 100-ns (lightpink, fE) and 200-ns (orange, fE) sampling subset from the above 600-ns MD simulation (red, fE) of free backbone in explicit solvent.
(B) The NMI per residue pair in a 4 Å distance bin for the same five samplings in Figure 1A. The NMI per residue pair in each 4 Å (Cα–Cα) distance bin is summed and then divided by number of residue pairs belonging to the bin.
The aNMI for a 200-ns sampling subset of the 600-ns MD simulation in explicit solvent with free backbone (Figure 1A) has a larger value of aNMI compared to the 600-ns simulation in the intermediate and long–range regime with a maximum near 18 Å. Indeed, the aNMI for a 100-ns subset sampling has even larger values over almost the entire range: the gap between the 100-ns and 200-ns curves is larger than that between the 200-ns and 600-ns curves.
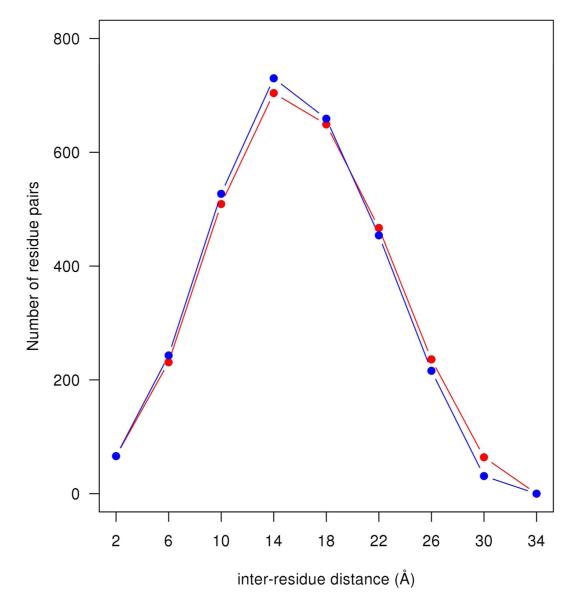
Figure 1B shows the NMI per residue pair vs. distance, i.e., for each 4 Å distance bin, the aNMI was divided by the number of residue pairs in a distance bin. A maximum occurs in the short-range regime of the inter–residue distance (~ 6 Å) for the five different sampling. Long-range peaks (of variable sizes) in the NMI per residue pair plots occur ~ 30 Å for the four different sampling cases. A partial reason for the functional difference between in Figure 1A and Figure 1B at long range apparently lies in the number of pairs in a bin. The distribution of number of pairs in a bin shows a parabolic–like shape as shown in Figure 2. (A parabolic–like shape for this distribution is also found, for instance, in a protein of larger size than barstar, cytochrome–P450 (PDB code: 2CPP) with 405 residues15 (data not shown). It is reasonable to suppose that this functional shape will be true for all globular proteins.) At the two extreme regimes (short and long-range) in the inter-residue distance, the number of pairs in a bin is relatively small (See Figure 2). Thus, the division of the aNMI (See Figure 1A) by the number of pairs in a bin contributes to a relative increase in the apparent side-chain correlations at short and long inter-residue distances, as well as relative suppression of apparent correlations at mid-range (See Figure 1B). We conclude that the NMI per residue pair in a bin may overemphasize the apparent long range order communication of mutual information relative to the aNMI, especially for the less sampled cases (100 and 200-ns). For the NMI per residue pair curve (Figure 1B), we find that the gap between the 100-ns and 200-ns sampling curves is larger than the gap between the 200-ns and 600-ns sampling curves, as was the case for the aNMI. Interestingly, the NMI perresidue pair plots (explicit solvent with free backbone or with fixed backbone) from the MD simulations (Figure 1B) show a similar pattern as compared with the result estimated from the Monte Carlo simulation2 (fixed backbone, implicit solvent).
Figure 2.
Number of residue pairs in a distance bin vs. distance of barstar for the last snapshot of the 600-ns MD simulation with free backbone in explicit solvent (red, fE) and for the X-ray crystal structure (PDB code: 1A19, C82A mutant of barstar, red).
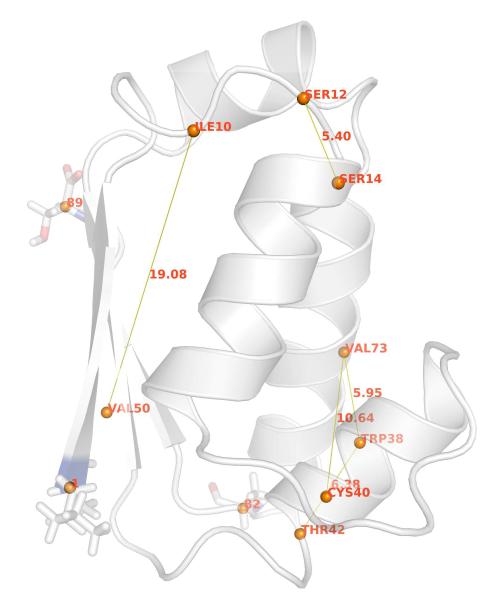
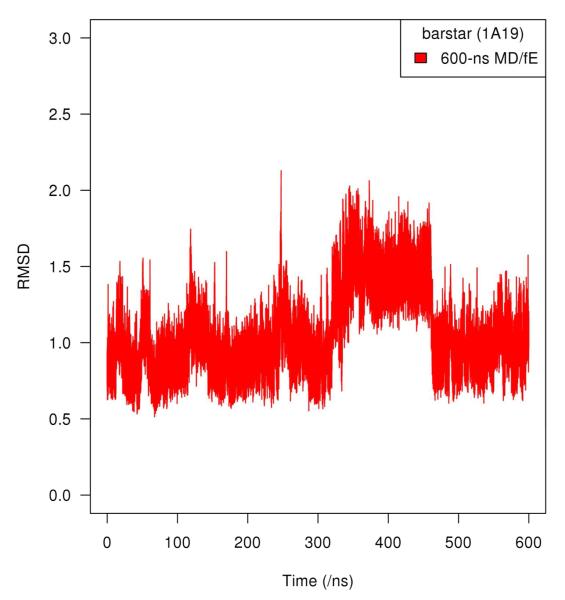
Figure 3 shows the secondary structure of the last snapshot of the 600-ns MD simulation in explicit solvent with free backbone. The five connecting lines (Figure 3) represent the five residue pairs with largest individual NMI values from the 600-ns MD simulation with free backbone in explicit solvent. The NMI values and Cα–Cα distance are listed in Table I. Among those five residue pairs shown in the Table I, three are short–range (~ 5–6 Å), one intermediate range (~ 11 Å), and one longer-range (~ 19 Å). Interestingly, the three side chains involved in the residue pairs with the five largest NMI values are also considered to be the critical residues in barnase–barstar binding: 38Trp, 42Thr and 73Val16. We find that residue 50Val is also involved in longer–range communication in both fixed backbone cases (Table 1). We also find that for the fixed backbone, explicit solvent case, longer range correlations persist at 600-ns (Table 1). The Cα–RMSD (simulation vs. X-ray crystal structure) for the 600-ns free backbone in explicit solvent case is shown in Figure 4.
Figure 3.
Barstar at the last snapshot of 600-ns MD simulation with free backbone in explicit solvent. The five lines represent residue pairs which have the five largest individual NMI per residue pair from the 600-ns MD simulation with free backbone in explicit solvent. Among the five residue pairs, three (73Val:38Trp, 42Thr:38Trp, and 12Ser:14Ser) are short-range (~ 5–6 Å), one (73Val:40Cys) intermediate range (~ 11 Å), and one (50Val:10Ile) longer-range regime (~ 19 Å). For the orientation of barstar (C82A mutant), the N-terminus and C-terminus residues are shown in stick representation, and the single mutation residue (C82A) is also shown in stick.
Table I.
Residue pairs with the five largest individual NMI per residue pair
| Explicit Solvent with free Backbone (600-ns MD) | |||
|
| |||
| rank | NMI | Cα-Cα Distance (Å) | Residue Pair |
|
| |||
| 1 | 0.088 | 10.64 | 40Cys:73Val |
| 2 | 0.076 | 5.95 | 38Trp:73Val |
| 3 | 0.059 | 19.08 | 10Ile:50Val |
| 4 | 0.052 | 5.40 | 12Ser:14Ser |
| 5 | 0.048 | 6.38 | 38Trp:42Thr |
|
| |||
| Explicit Solvent with Fixed Backbone (600-ns MD) | |||
|
| |||
| rank | NMI | Cα-Cα Distance (Å) | Residue Pair |
|
| |||
| 1 | 0.138 | 16.77 | 16Leu:50Val |
| 2 | 0.082 | 5.40 | 12Ser:14Ser |
| 3 | 0.060 | 14.51 | 6Asn:50Val |
| 4 | 0.055 | 8.87 | 6Asn:16Leu |
| 5 | 0.032 | 26.00 | 6Asn:29Tyr |
|
| |||
| Implicit Solvent with Fixed Backbone (600-ns MD) | |||
|
| |||
| rank | NMI | Cα-Cα Distance (Å) | Residue Pair |
|
| |||
| 1 | 0.051 | 5.40 | 12Ser:14Ser |
| 2 | 0.028 | 9.19 | 41Leu:73Val |
| 3 | 0.026 | 21.21 | 13Ile:50Val |
| 4 | 0.015 | 19.25 | 13Ile:41Leu |
| 5 | 0.012 | 5.40 | 12Ser:15Asp |
|
| |||
| Explicit Solvent with free Backbone (100-ns MD) | |||
|
| |||
| rank | NMI | Cα-Cα Distance (Å) | Residue Pair |
|
| |||
| 1 | 0.097 | 15.89 | 50Val:80Glu |
| 2 | 0.092 | 14.51 | 6Asn:50Val |
| 3 | 0.092 | 19.08 | 10Ile:50Val |
| 4 | 0.066 | 22.62 | 28Glu:50Val |
| 5 | 0.057 | 19.83 | 6Asn:41Leu |
Figure 4.
Cα-RMSD (Root Mean Square Displacement) profiles relative to the crystal structure (PDB code: 1A19, C82A mutant barstar) for 600 ns MD simulation with free backbone and explicit solvent.
The effect of sampling time on entropy evaluation for MD simulation has been previously studied with the conclusion that increasingly longer simulation time is better17. This is apparent in Figure 1B: using this figure to assess long range side chain communications, we would reach very different conclusions for 100-ns sampling vs. 600-ns sampling. On the other hand, we note that the longest range NMI per residue pair (~ 19.1 Å for 10Ile:50Val, Table 1) was already present at 100-ns for the free backbone in explicit solvent simulation.
CONCLUSIONS
We are hard-pressed to conclude that there is unusual long-range communication between side chains in barstar. For the free backbone in explicit solvent case, the accumulated NMI (Figure 1A) plot does not support this conclusion, nor does the NMI per residue pair plot (for 600-ns). The top individual NMI values (Table 1) go only to ~ 19 Å. For the fixed backbone in implicit solvent 600-ns simulation, which has much smaller aNMI and NMI per residue pair values, the same conclusions hold. Only for the case of 600-ns, fixed backbone, explicit solvent does a long-range peak (~ 30 Å) persist in the NMI vs. distance plot. The importance of increased sampling is evident in both Figure 1A and 1B.
Acknowledgments
Grant source: NIH, Grant number: HL-06350
REFERNCES
- 1.Pandini A, Fornili A, Fraternali F, Kleinjung J. Detection of allosteric signal transmission by information-theoretic analysis of protein dynamics. The FASEB journal. 2012;26:868–881. doi: 10.1096/fj.11-190868. [DOI] [PMC free article] [PubMed] [Google Scholar]
- 2.DuBay KH, Bothma JP, Geissler PL. Long–range intra-protein communication can be transmitted by correlated side-chain fluctuation alone. PLos Comput Biol. 2011;7:e1002168. doi: 10.1371/journal.pcbi.1002168. [DOI] [PMC free article] [PubMed] [Google Scholar]
- 3.McClendon CL, Friedland G, Mobley DL, Amirkhani H, Jacobson MP. Quantifying correlations between allosteric sites in thermodynamic ensembles. J Chem Theory Comput. 2009;5:2486. doi: 10.1021/ct9001812. [DOI] [PMC free article] [PubMed] [Google Scholar]
- 4.Hünenberger PH, Mark AE, van Gunsteren WF. Fluctuation and cross-correlation analysis of protein motions observed in nanosecond molecular dynamics simulations. J Mol Biol. 1995;252:492. doi: 10.1006/jmbi.1995.0514. [DOI] [PubMed] [Google Scholar]
- 5.Papaleo E, Lindorff-Larsen K, De Gioia L. Paths of long-range communication in the E2 enzymes of family 3: a molecular dynamics investigation. Phys Chem Chem Phys. 2012;14:12515. doi: 10.1039/c2cp41224a. [DOI] [PubMed] [Google Scholar]
- 6.Ratnaparkhi GS, Ramachandran S, Udgaonkar JB, Varadarajan R. Discrepancies between the NMR and X-ray structures of uncomplexed barstar:analysis suggests that packing densities of protein structures determined by NMR are unreliable. Biochemistry. 1998;37:6958–6966. doi: 10.1021/bi972857n. [DOI] [PubMed] [Google Scholar]
- 7.Phillips JC, Braun R, Wang W, Gumbart J, Tajkhorshid E, Villa E, Chipot C, Skeel RD, Kale L, Schulten K. Scalable molecular dynamics with NAMD. J Comput Chem. 2005;26:1781–1802. doi: 10.1002/jcc.20289. [DOI] [PMC free article] [PubMed] [Google Scholar]
- 8.MacKerell AD, Jr, Bashford D, Bellott M, Dunbrack RL, Jr, Evanseck J, Field MJ, Fischer S, Gao J, Guo H, Ha S, Joseph D, Kuchnir L, Kuczera K, Lau FTK, Mattos C, Michnick S, Ngo T, Nguyen DT, Prodhom B, Reiher WE, III, Roux B, Schlenkrich M, Smith JC, Stote R, Straub J, Watanabe M, Wiorkiewicz-Kuczera J, Yin D, Karplus M. All-Atom Empirical Potential for Molecular Modeling and Dynamics Studies of Proteins. J Phys Chem B. 1998;102:3586–3616. doi: 10.1021/jp973084f. [DOI] [PubMed] [Google Scholar]
- 9.Mackerell AD, Jr, Feig M, Brooks CL., III Extending the treatment of backbone energetic in protein force fields: limitations of gas phase quantum mechanics in reproducing protein conformational distributions in molecular dynamics simulations. J Comput Chem. 2004;25:1400–1415. doi: 10.1002/jcc.20065. [DOI] [PubMed] [Google Scholar]
- 10.Jorgensen WL, Chandrasekhar J, Madura JD, Impey RW, Klein ML. Comparison of simple potential functions for simulating liquid water. J Chem Phys. 1983;79:926–935. [Google Scholar]
- 11.Humphrey W, Dalke A, Schulten K. VMD: visual molecular dynamics. J Mol Graph. 1996;14:33–38. doi: 10.1016/0263-7855(96)00018-5. [DOI] [PubMed] [Google Scholar]
- 12.Darden T, York D, Pedersen L. Particle mesh Ewald: An Nlog(N) method for Ewald sums in large systems. J Chem Phys. 1993;98:10089–10093. [Google Scholar]
- 13.Feller SE, Zhang Y, Pastor RW, Brooks BR. Constant pressure molecular dynamics simulation: The Langevin piston method. J Chem Phys. 1995;103:4613–4621. [Google Scholar]
- 14.Roulston M. Estimating the errors on measured entropy and mutual information. Phys D. 1999;125:285–294. (1999) [Google Scholar]
- 15.Poulos TL, Finzel BC, Howard AJ. High-resolution crystal structure of cytochrome P450cam. J Mol Biol. 1987;196:687–700. doi: 10.1016/0022-2836(87)90190-2. [DOI] [PubMed] [Google Scholar]
- 16.Lee L, Tidor B. Barstar is electrostatistically optimized for tight binding to barnase. Nat Struct Biol. 2001;8:73–76. doi: 10.1038/83082. [DOI] [PubMed] [Google Scholar]
- 17.Genheden S, Ryde U. Will molecular dynamics simulations of proteins ever reach equilibrium? Phys Chem Chem Phys. 2012;14:8662–8677. doi: 10.1039/c2cp23961b. [DOI] [PubMed] [Google Scholar]


