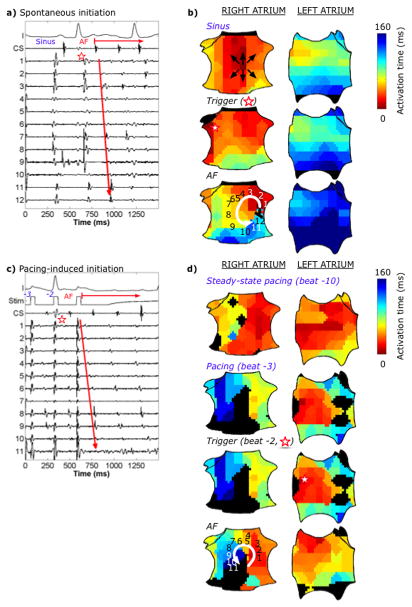
Figure 3.
Multiple AF initiations via a spiral wave in an 81-year-old man with paroxysmal AF. (a) Spontaneous initiation: ECG and intracardiac recordings. Electrograms 1–12 represent sites 1–12 in panel (b). (b) Spatial activation maps show the corresponding sinus beat (top panel) followed by a spontaneous RA PAC (middle panel, red star, >22ms earlier than other sites) causing slowed conduction in the inferior RA. The first AF cycle (bottom panel) encounters tissue that activated late in the prior beat, causing block with formation of a counterclockwise spiral wave in the mid-septal RA that initiates AF. (c) Pacing-induced AF initiation, 10 minutes after the previous initiation, at burst pacing CL260ms near the right superior PV. Electrograms 1–11 represent sites 1–11 in panel (d). (d) Steady-state pacing (top panel, electrograms not shown) shows rapid activation that slowed with increasing rate in RA as shown in the final 2 paced beats prior to AF (second and third panels, respectively) leading to an AF-initiating spiral with similar location and CL to panels (a, b). Color maps in (d) represent true RA activation time referenced to pacing artifact. Despite different LA activity and quite different triggers, the same AF-initiating RA spiral wave is formed. Black areas represent diastole in the transition to established AF.

