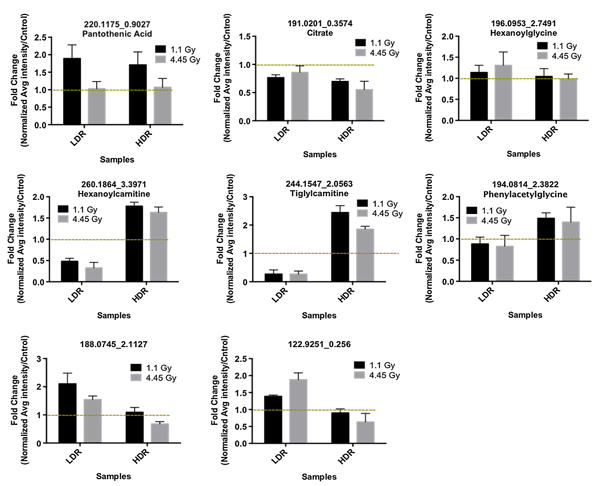
Fig. 3.

Individual metabolite responses to dose rate. On top are three metabolites that do not show significant dose rate responses and at the bottom are those whose urinary excretion levels change with respect to dose rate 2 day post-irradiation. The dotted line marks fold change of 1, which in each graph represents no change in the abundance of the metabolite pre- and post-irradiation. The identity of pantothenic acid, citrate, hexanoylglycine, hexanoylcarnitine, tiglylcarnitine, phenylacetylglycine were validated via MS/MS fragmentation. No names could be assigned to metabolites at m/z of 188.0745 and 122.9251
