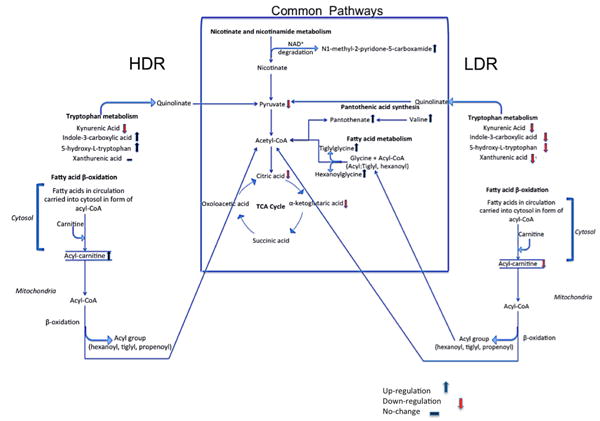
Fig. 5.

Schematic of pathways that were determined to be affected significantly as a result of irradiation. The pathways within the box represent those that show similar perturbations with LDR and HDR independent of dose rate. Pathways to the left (HDR) and right (LDR) of the box are those whose metabolites show dose rate responses postirradiation. Notice that tryptophan and fatty β-oxidation pathways are both affected; however, the levels of their indicated metabolites changed in opposite direction post-irradiation with respect to dose rate
