
Figure 7.
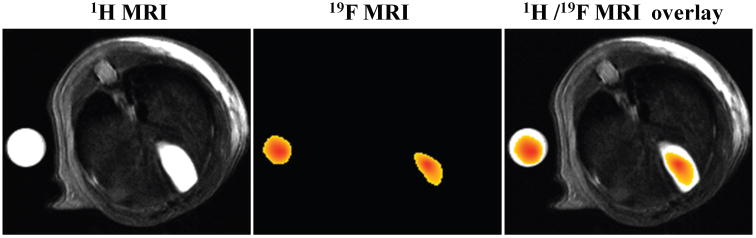
CA-sar-TFMA in vivo MR images. The left-most panel shows a 1H MR image of the cross section of mouse 6's body, with a phantom of CA-sar-TFMA imaged adjacent to the body. The center panel shows the 19F MR image of the same cross-section. The right-most panel shows an overlay of the 1H and 19F images. CA-sar-TFMA signal intensity of the gallbladder region of interest (ROI) was normalized to the phantom ROI, and gallbladder concentration was calculated to be 34.2 mM.